PROTECTED SOURCE SCRIPT
업데이트됨 ADX + DI + EMA Dashboard (BKNY)
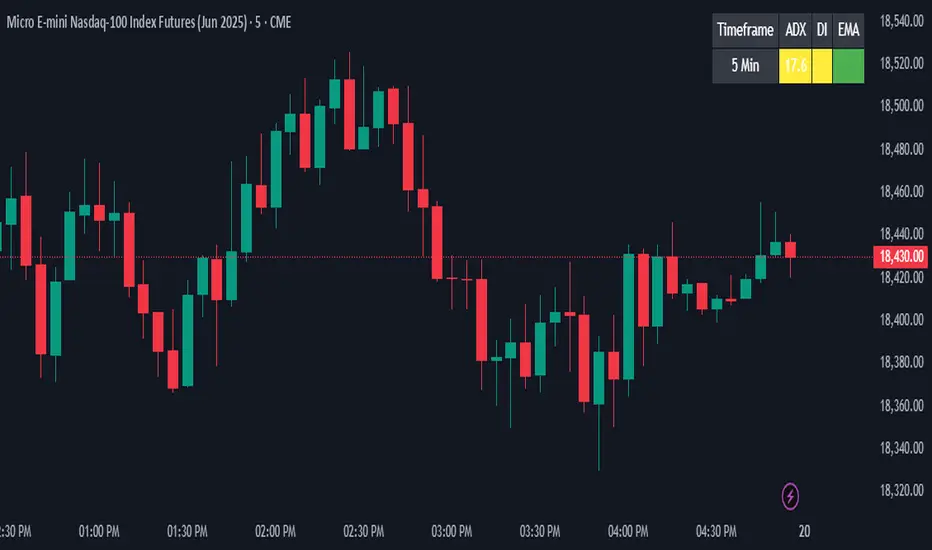
This Indicator creates a dynamic dashboard that combines ADX (Average Directional Index), Directional Movement Index (DI), and Exponential Moving Averages (EMA) to provide a comprehensive view of market trends. The indicator helps traders assess the strength and direction of trends based on key technical indicators.
Features:
ADX: Measures the strength of the trend, allowing traders to identify whether a trend is strong or weak.
+DI and -DI: Show the bullish and bearish directional movements, helping to identify market direction.
EMA Crossover: Compares the fast and slow EMAs to determine the trend’s direction.
Customizable Features:
Adjust the calculation length for ADX, DI, and EMAs.
Set ADX and DI thresholds to define trend strength and direction.
EMA lengths are fully customizable for both fast and slow EMAs.
Display options allow users to show or hide ADX, DI, and EMA values on the dashboard.
Customize the colors to represent bullish, bearish, or neutral trend conditions for ADX, DI, and EMA.
Timeframe selection allows users to choose the preferred timeframe for trend analysis.
The dashboard layout and display are fully customizable, letting users tailor the information shown according to their trading preferences.
This script provides an at-a-glance view of key trend indicators, with flexibility to tailor both the data shown and the visual presentation to individual trading needs.
릴리즈 노트
This Indicator creates a dynamic dashboard that combines ADX (Average Directional Index), Directional Movement Index (DI), and Exponential Moving Averages (EMA) to provide a comprehensive view of market trends. The indicator helps traders assess the strength and direction of trends based on key technical indicators.Features:
ADX: Measures the strength of the trend, allowing traders to identify whether a trend is strong or weak.
+DI and -DI: Show the bullish and bearish directional movements, helping to identify market direction.
EMA Crossover: Compares the fast and slow EMAs to determine the trend’s direction.
Customizable Features:
Adjust the calculation length for ADX, DI, and EMAs.
Set ADX and DI thresholds to define trend strength and direction.
EMA lengths are fully customizable for both fast and slow EMAs.
Display options allow users to show or hide ADX, DI, and EMA values on the dashboard.
Customize the colors to represent bullish, bearish, or neutral trend conditions for ADX, DI, and EMA.
Timeframe selection allows users to choose the preferred timeframe for trend analysis.
The dashboard layout and display are fully customizable, letting users tailor the information shown according to their trading preferences.
This script provides an at-a-glance view of key trend indicators, with flexibility to tailor both the data shown and the visual presentation to individual trading needs.
1 hour ago
Release Notes
This Indicator creates a dynamic dashboard that combines ADX (Average Directional Index), Directional Movement Index (DI), and Exponential Moving Averages (EMA) to provide a comprehensive view of market trends. The indicator helps traders assess the strength and direction of trends based on key technical indicators.
Features:
ADX: Measures the strength of the trend, allowing traders to identify whether a trend is strong or weak.
+DI and -DI: Show the bullish and bearish directional movements, helping to identify market direction.
EMA Crossover: Compares the fast and slow EMAs to determine the trend’s direction.
Customizable Features:
Adjust the calculation length for ADX, DI, and EMAs.
Set ADX and DI thresholds to define trend strength and direction.
EMA lengths are fully customizable for both fast and slow EMAs.
Display options allow users to show or hide ADX, DI, and EMA values on the dashboard.
Customize the colors to represent bullish, bearish, or neutral trend conditions for ADX, DI, and EMA.
Timeframe selection allows users to choose the preferred timeframe for trend analysis.
The dashboard layout and display are fully customizable, letting users tailor the information shown according to their trading preferences.
This script provides an at-a-glance view of key trend indicators, with flexibility to tailor both the data shown and the visual presentation to individual trading needs.
릴리즈 노트
Increased precision of calculated values보호된 스크립트입니다
이 스크립트는 비공개 소스로 게시됩니다. 하지만 이를 자유롭게 제한 없이 사용할 수 있습니다 – 자세한 내용은 여기에서 확인하세요.
면책사항
해당 정보와 게시물은 금융, 투자, 트레이딩 또는 기타 유형의 조언이나 권장 사항으로 간주되지 않으며, 트레이딩뷰에서 제공하거나 보증하는 것이 아닙니다. 자세한 내용은 이용 약관을 참조하세요.
면책사항
해당 정보와 게시물은 금융, 투자, 트레이딩 또는 기타 유형의 조언이나 권장 사항으로 간주되지 않으며, 트레이딩뷰에서 제공하거나 보증하는 것이 아닙니다. 자세한 내용은 이용 약관을 참조하세요.