OPEN-SOURCE SCRIPT
Bitcoin MVRV Z-Score Indicator
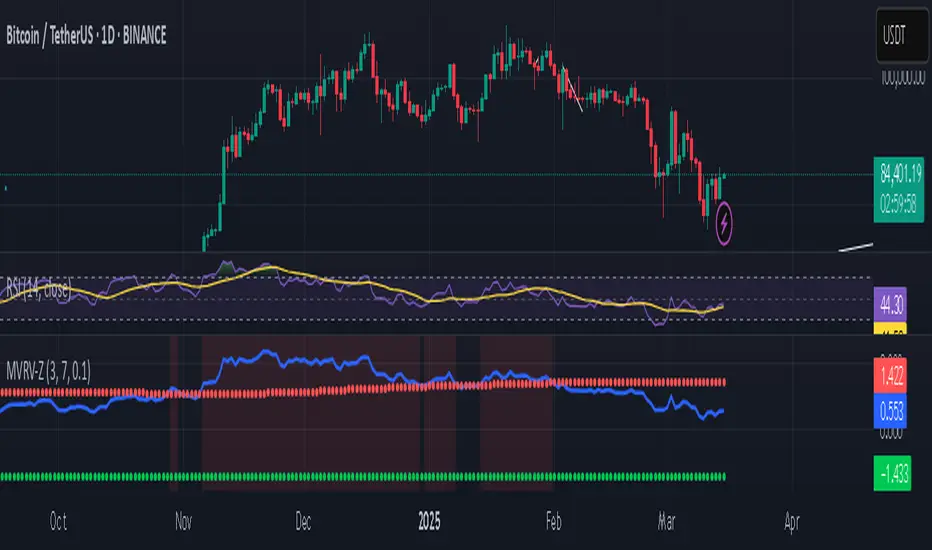
### **What This Script Does (In Plain English)**
Imagine Bitcoin has a "fair price" based on what people *actually paid* for it (called the **Realized Value**). This script tells you if Bitcoin is currently **overpriced** or **underpriced** compared to that fair price, using math.
---
### **How It Works (Like a Car Dashboard)**
1. **The Speedometer (Z-Score Line)**
- The blue line (**Z-Score**) acts like a speedometer for Bitcoin’s price:
- **Above Red Line** → Bitcoin is "speeding" (overpriced).
- **Below Green Line** → Bitcoin is "parked" (underpriced).
2. **The Warning Lights (Colors)**
- **Red Background**: "Slow down!" – Bitcoin might be too expensive.
- **Green Background**: "Time to fuel up!" – Bitcoin might be a bargain.
3. **The Alarms (Alerts)**
- Your phone buzzes when:
- Green light turns on → "Buy opportunity!"
- Red light turns on → "Be careful – might be time to sell!"
---
### **Real-Life Example**
- **2021 Bitcoin Crash**:
- The red light turned on when Bitcoin hit $60,000+ (Z-Score >7).
- A few months later, Bitcoin crashed to $30,000.
- **2023 Rally**:
- The green light turned on when Bitcoin was around $20,000 (Z-Score <0.1).
- Bitcoin later rallied to $35,000.
---
### **How to Use It (3 Simple Steps)**
1. **Look at the Blue Line**:
- If it’s **rising toward the red zone**, Bitcoin is getting expensive.
- If it’s **falling toward the green zone**, Bitcoin is getting cheap.
2. **Check the Colors**:
- Trade carefully when the background is **red**.
- Look for buying chances when it’s **green**.
3. **Set Alerts**:
- Get notified when Bitcoin enters "cheap" or "expensive" zones.
---
### **Important Notes**
- **Not Magic**: This tool helps spot trends but isn’t perfect. Always combine it with other indicators.
- **Best for Bitcoin**: Works great for Bitcoin, not as well for altcoins.
- **Long-Term Focus**: Signals work best over months/years, not hours.
---
Think of it as a **thermometer for Bitcoin’s price fever** – it tells you when the market is "hot" or "cold." 🔥❄️
오픈 소스 스크립트
트레이딩뷰의 진정한 정신에 따라, 이 스크립트의 작성자는 이를 오픈소스로 공개하여 트레이더들이 기능을 검토하고 검증할 수 있도록 했습니다. 작성자에게 찬사를 보냅니다! 이 코드는 무료로 사용할 수 있지만, 코드를 재게시하는 경우 하우스 룰이 적용된다는 점을 기억하세요.
면책사항
해당 정보와 게시물은 금융, 투자, 트레이딩 또는 기타 유형의 조언이나 권장 사항으로 간주되지 않으며, 트레이딩뷰에서 제공하거나 보증하는 것이 아닙니다. 자세한 내용은 이용 약관을 참조하세요.
오픈 소스 스크립트
트레이딩뷰의 진정한 정신에 따라, 이 스크립트의 작성자는 이를 오픈소스로 공개하여 트레이더들이 기능을 검토하고 검증할 수 있도록 했습니다. 작성자에게 찬사를 보냅니다! 이 코드는 무료로 사용할 수 있지만, 코드를 재게시하는 경우 하우스 룰이 적용된다는 점을 기억하세요.
면책사항
해당 정보와 게시물은 금융, 투자, 트레이딩 또는 기타 유형의 조언이나 권장 사항으로 간주되지 않으며, 트레이딩뷰에서 제공하거나 보증하는 것이 아닙니다. 자세한 내용은 이용 약관을 참조하세요.