INVITE-ONLY SCRIPT
Каналы_SMA_magistratura
⚜️ Custom Indicator "ChannelsSMA_magistratura" — Seeing Trends as Zones, Not Lines
🔹 Why traditional trend lines aren't always practical?
— We draw trend lines, parallels, resistance levels — and the chart turns into a "geometry notebook",
— Every new impulse requires a new channel,
— Old lines get in the way and need to be deleted,
→ This is inefficient, unstructured, and not scalable.
🔹 Alternative — Moving Averages (SMA)
— SMAs show the trend direction without extra drawings,
— We already use SMA Magistratura to see all moving averages across timeframes,
— But we can go even further.
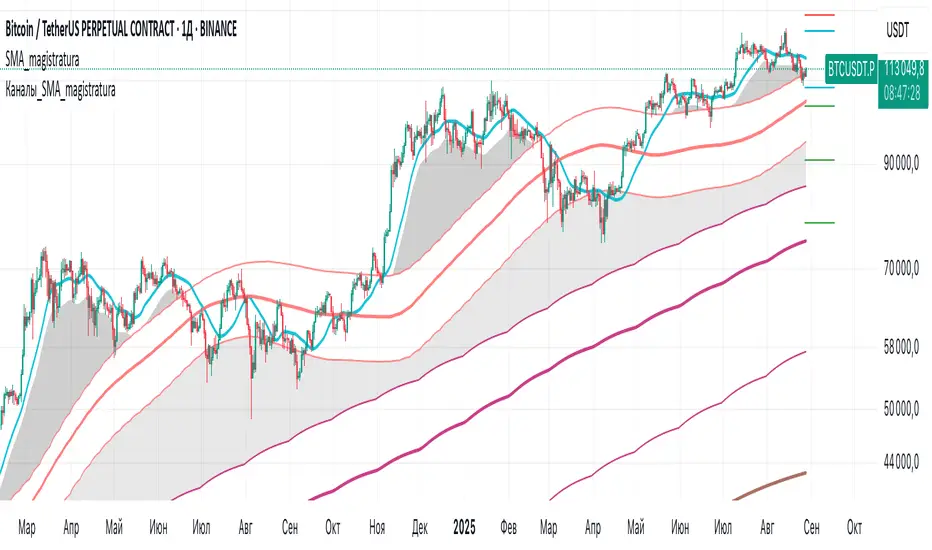
🔹 What are "ChannelsSMA_magistratura"?
— A custom indicator that turns SMA lines into zones,
— Each moving average is surrounded by a channel,
— Channel width is optimized based on backtesting,
→ Shows the normal price range around each SMA.
🔹 How the indicator works
— Visually:
SMA — central line,
Channel boundaries — on both sides,
The space between channels — filled in gray.
📌 Gray zones = deviations we call "gaps" (or "breakouts").
🔹 Normal vs. Anomaly
✅ Normal (Equilibrium):
— Price moves within the channel,
— Channels are nested:
→ Daily inside Weekly,
→ Weekly inside Monthly,
→ Monthly inside 3-Monthly.
→ Market is balanced — low volatility, stable trend.
⚠️ Anomaly (Gap):
— Price moves outside the channel,
— Channels diverge, forming a fan:
→ Monthly separates from 3-Monthly,
→ Weekly from Monthly,
→ Daily from Weekly.
→ This signals volatility, potential impulse, or correction.
🔹 Why are gaps the best entry points?
— A gap = anomalous deviation,
— Market is overbought or oversold,
— The wider the gap — the higher the chance of a strong reversal or new impulse.
📌 Example:
— Before a strong rally, price accumulates inside the channel,
— Then — a sharp breakout, piercing multiple levels.
🔹 Why is this indicator separate?
— Not always needed,
— Can be turned on/off for local analysis,
— Keeps the chart clean when using other tools.
🔹 Advantages over manual drawing
— No need to build channels manually,
— No guessing where support/resistance is,
— Everything is visible in advance, visually, and systematically.
"ChannelsSMA_magistratura" is not just an indicator.
It’s a way to see the trend not as a line — but as a zone.
It’s the ability to see not what has already happened,
but what is about to happen.
🔹 Why traditional trend lines aren't always practical?
— We draw trend lines, parallels, resistance levels — and the chart turns into a "geometry notebook",
— Every new impulse requires a new channel,
— Old lines get in the way and need to be deleted,
→ This is inefficient, unstructured, and not scalable.
🔹 Alternative — Moving Averages (SMA)
— SMAs show the trend direction without extra drawings,
— We already use SMA Magistratura to see all moving averages across timeframes,
— But we can go even further.
🔹 What are "ChannelsSMA_magistratura"?
— A custom indicator that turns SMA lines into zones,
— Each moving average is surrounded by a channel,
— Channel width is optimized based on backtesting,
→ Shows the normal price range around each SMA.
🔹 How the indicator works
— Visually:
SMA — central line,
Channel boundaries — on both sides,
The space between channels — filled in gray.
📌 Gray zones = deviations we call "gaps" (or "breakouts").
🔹 Normal vs. Anomaly
✅ Normal (Equilibrium):
— Price moves within the channel,
— Channels are nested:
→ Daily inside Weekly,
→ Weekly inside Monthly,
→ Monthly inside 3-Monthly.
→ Market is balanced — low volatility, stable trend.
⚠️ Anomaly (Gap):
— Price moves outside the channel,
— Channels diverge, forming a fan:
→ Monthly separates from 3-Monthly,
→ Weekly from Monthly,
→ Daily from Weekly.
→ This signals volatility, potential impulse, or correction.
🔹 Why are gaps the best entry points?
— A gap = anomalous deviation,
— Market is overbought or oversold,
— The wider the gap — the higher the chance of a strong reversal or new impulse.
📌 Example:
— Before a strong rally, price accumulates inside the channel,
— Then — a sharp breakout, piercing multiple levels.
🔹 Why is this indicator separate?
— Not always needed,
— Can be turned on/off for local analysis,
— Keeps the chart clean when using other tools.
🔹 Advantages over manual drawing
— No need to build channels manually,
— No guessing where support/resistance is,
— Everything is visible in advance, visually, and systematically.
"ChannelsSMA_magistratura" is not just an indicator.
It’s a way to see the trend not as a line — but as a zone.
It’s the ability to see not what has already happened,
but what is about to happen.
초대 전용 스크립트
이 스크립트는 작성자가 승인한 사용자만 접근할 수 있습니다. 사용하려면 요청 후 승인을 받아야 하며, 일반적으로 결제 후에 허가가 부여됩니다. 자세한 내용은 아래 작성자의 안내를 따르거나 NZ_27에게 직접 문의하세요.
TradingView does NOT recommend paying for or using a script unless you fully trust its author and understand how it works. You may also find free, open-source alternatives in our community scripts.
작성자 지시 사항
Индикатор доступен:
+ ученикам Академии трейдинга 2.0
+ ученикам Магистратуры
+ участникам реферальной программы Магистратура (через Bybit, OKX, BingX, Tradingview)
Проект "МАГИСТРАТУРА"
면책사항
해당 정보와 게시물은 금융, 투자, 트레이딩 또는 기타 유형의 조언이나 권장 사항으로 간주되지 않으며, 트레이딩뷰에서 제공하거나 보증하는 것이 아닙니다. 자세한 내용은 이용 약관을 참조하세요.