OPEN-SOURCE SCRIPT
업데이트됨 SW Gann Pressure time from tops and bottoms
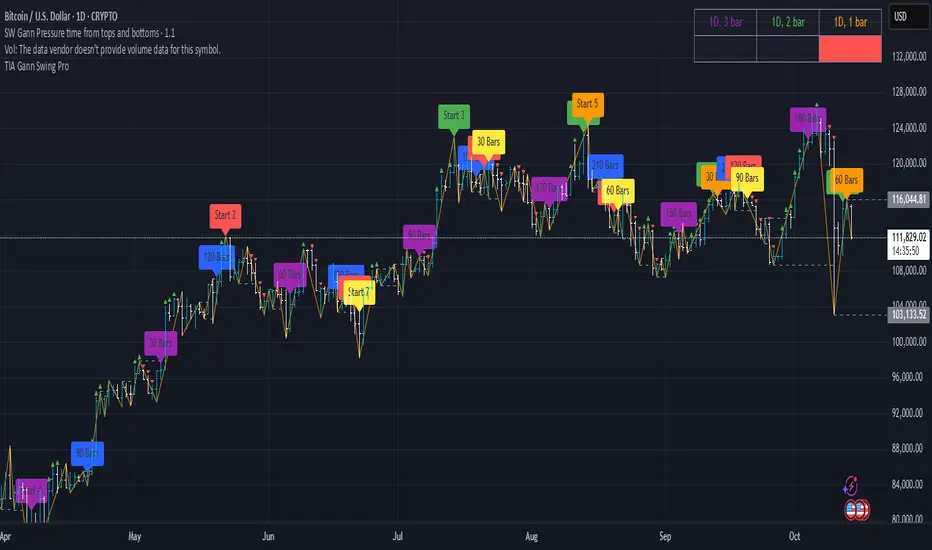
W.D. Gann's trading techniques often emphasized the significance of time in the markets, believing that specific time intervals could influence price movements. Here’s how the 30, 60, 90, 120, 180, and 270 bar intervals relate to Gann's rules:
1. **30 Bars**:
- Gann often viewed shorter time frames as critical for identifying short-term trends. A 30-bar interval can signify minor cycles or potential turning points in price.
2. **60 Bars**:
- This interval is significant as Gann believed in the importance of quarterly cycles. A 60-bar mark could indicate a completion of a two-month cycle, often leading to retracements or reversals.
3. **90 Bars**:
- Gann considered 90 days (or bars) to represent a quarter. This interval can signify a substantial shift in market sentiment or a pivotal point in a longer trend.
4. **120 Bars**:
- The 120-bar mark corresponds to about four months. Gann viewed longer intervals as more significant, often leading to major shifts in market trends.
5. **180 Bars**:
- A 180-bar period relates to a semi-annual cycle, which Gann regarded as critical for major support and resistance levels. Price action around this interval can reveal potential long-term trend reversals.
6. **270 Bars**:
- Gann believed that longer cycles, such as 270 bars (approximately nine months), could indicate significant market phases. This interval may represent major turning points and help identify long-term trends.
### Application in Trading:
- **Identifying Trends**: Traders can use these intervals to spot potential trend reversals or continuations based on Gann’s principles of market cycles.
- **Setting Targets and Stops**: Knowing where these key bars fall can help in setting profit targets and stop-loss orders.
- **Analyzing Market Sentiment**: Price reactions at these intervals can provide insights into market psychology and sentiment shifts.
By marking these intervals on a chart, traders can visually assess when price action aligns with Gann's theories, helping them make more informed trading decisions based on historical patterns and cycles.
릴리즈 노트
W.D. Gann's trading techniques often emphasized the significance of time in the markets, believing that specific time intervals could influence price movements. Here’s how the 30, 60, 90, 120, 180, and 270 bar intervals relate to Gann's rules:1. **30 Bars**:
- Gann often viewed shorter time frames as critical for identifying short-term trends. A 30-bar interval can signify minor cycles or potential turning points in price.
2. **60 Bars**:
- This interval is significant as Gann believed in the importance of quarterly cycles. A 60-bar mark could indicate a completion of a two-month cycle, often leading to retracements or reversals.
3. **90 Bars**:
- Gann considered 90 days (or bars) to represent a quarter. This interval can signify a substantial shift in market sentiment or a pivotal point in a longer trend.
4. **120 Bars**:
- The 120-bar mark corresponds to about four months. Gann viewed longer intervals as more significant, often leading to major shifts in market trends.
5. **180 Bars**:
- A 180-bar period relates to a semi-annual cycle, which Gann regarded as critical for major support and resistance levels. Price action around this interval can reveal potential long-term trend reversals.
6. **270 Bars**:
- Gann believed that longer cycles, such as 270 bars (approximately nine months), could indicate significant market phases. This interval may represent major turning points and help identify long-term trends.
### Application in Trading:
- **Identifying Trends**: Traders can use these intervals to spot potential trend reversals or continuations based on Gann’s principles of market cycles.
- **Setting Targets and Stops**: Knowing where these key bars fall can help in setting profit targets and stop-loss orders.
- **Analyzing Market Sentiment**: Price reactions at these intervals can provide insights into market psychology and sentiment shifts.
By marking these intervals on a chart, traders can visually assess when price action aligns with Gann's theories, helping them make more informed trading decisions based on historical patterns and cycles.
Nov 2
Release Notes
W.D. Gann's trading techniques often emphasized the significance of time in the markets, believing that specific time intervals could influence price movements. Here’s how the 30, 60, 90, 120, 180, and 270 bar intervals relate to Gann's rules:
1. **30 Bars**:
- Gann often viewed shorter time frames as critical for identifying short-term trends. A 30-bar interval can signify minor cycles or potential turning points in price.
2. **60 Bars**:
- This interval is significant as Gann believed in the importance of quarterly cycles. A 60-bar mark could indicate a completion of a two-month cycle, often leading to retracements or reversals.
3. **90 Bars**:
- Gann considered 90 days (or bars) to represent a quarter. This interval can signify a substantial shift in market sentiment or a pivotal point in a longer trend.
4. **120 Bars**:
- The 120-bar mark corresponds to about four months. Gann viewed longer intervals as more significant, often leading to major shifts in market trends.
5. **180 Bars**:
- A 180-bar period relates to a semi-annual cycle, which Gann regarded as critical for major support and resistance levels. Price action around this interval can reveal potential long-term trend reversals.
6. **270 Bars**:
- Gann believed that longer cycles, such as 270 bars (approximately nine months), could indicate significant market phases. This interval may represent major turning points and help identify long-term trends.
### Application in Trading:
- **Identifying Trends**: Traders can use these intervals to spot potential trend reversals or continuations based on Gann’s principles of market cycles.
- **Setting Targets and Stops**: Knowing where these key bars fall can help in setting profit targets and stop-loss orders.
- **Analyzing Market Sentiment**: Price reactions at these intervals can provide insights into market psychology and sentiment shifts.
By marking these intervals on a chart, traders can visually assess when price action aligns with Gann's theories, helping them make more informed trading decisions based on historical patterns and cycles.
릴리즈 노트
days 30,60,90,120,150,180,210,240,270,300,330,360 from peaks and troughs오픈 소스 스크립트
트레이딩뷰의 진정한 정신에 따라, 이 스크립트의 작성자는 이를 오픈소스로 공개하여 트레이더들이 기능을 검토하고 검증할 수 있도록 했습니다. 작성자에게 찬사를 보냅니다! 이 코드는 무료로 사용할 수 있지만, 코드를 재게시하는 경우 하우스 룰이 적용된다는 점을 기억하세요.
면책사항
해당 정보와 게시물은 금융, 투자, 트레이딩 또는 기타 유형의 조언이나 권장 사항으로 간주되지 않으며, 트레이딩뷰에서 제공하거나 보증하는 것이 아닙니다. 자세한 내용은 이용 약관을 참조하세요.
오픈 소스 스크립트
트레이딩뷰의 진정한 정신에 따라, 이 스크립트의 작성자는 이를 오픈소스로 공개하여 트레이더들이 기능을 검토하고 검증할 수 있도록 했습니다. 작성자에게 찬사를 보냅니다! 이 코드는 무료로 사용할 수 있지만, 코드를 재게시하는 경우 하우스 룰이 적용된다는 점을 기억하세요.
면책사항
해당 정보와 게시물은 금융, 투자, 트레이딩 또는 기타 유형의 조언이나 권장 사항으로 간주되지 않으며, 트레이딩뷰에서 제공하거나 보증하는 것이 아닙니다. 자세한 내용은 이용 약관을 참조하세요.