OPEN-SOURCE SCRIPT
업데이트됨 Urika Trend Strength
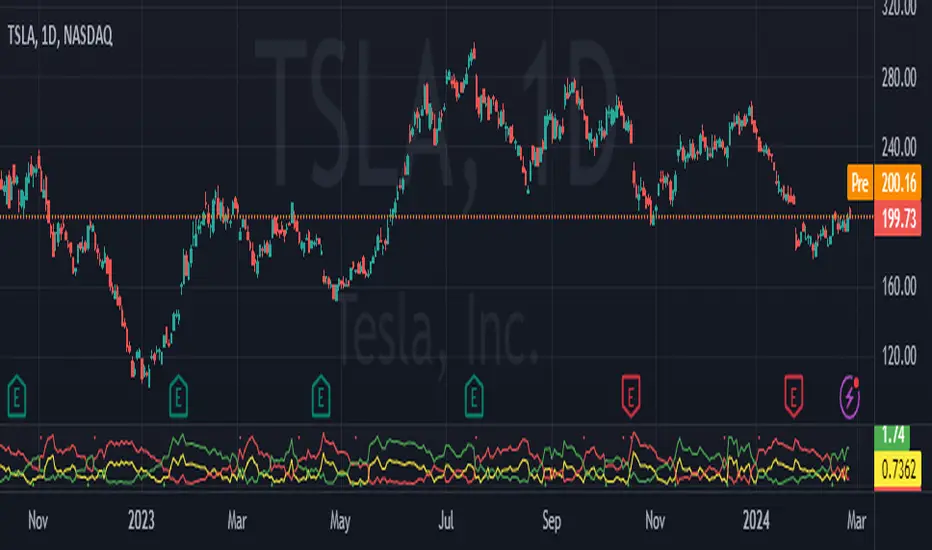
The Urika Directional Strength (UDS) indicator calculates and visualizes the strength of the directional trend in the price data. It helps traders see the strength and direction of the trend and allows them to make informed trading decisions based on trend changes.
Calculation:
The Simple Moving Average is used to determine the upper and lower directional bands by adding and subtracting the product of the standard deviation of the price data and the multiplier of the moving average.
Direction: The upward directional trend and downward directional trend are calculated by taking the absolute value of the difference between the price data and the upper and lower directional bands, divided by the product of the standard deviation and the multiplier.
Strength: It is calculated by taking the absolute value of the difference between the price data and the moving average, divided by the product of the standard deviation and the multiplier.
Interpretation:
Direction: The position of the long and short lines at the top indicates the direction of the ticker. Long line for long position and Short line for short position.
Strength: When the Strength line is below the directional lines, it is a weak trend or consolidating. If it stays in between the two directional lines, it is a strong trend.
릴리즈 노트
The Urika Trend Strength (UTS) indicator calculates and visualizes the strength of the directional trend in the price data. It helps traders see the strength and direction of the trend and allows them to make informed trading decisions based on trend changes.Calculation:
The Simple Moving Average is used to determine the upper and lower directional bands by adding and subtracting the product of the standard deviation of the price data and the multiplier of the moving average.
Direction: The upward directional trend and downward directional trend are calculated by taking the absolute value of the difference between the price data and the upper and lower directional bands, divided by the product of the standard deviation and the multiplier.
Strength: It is calculated by taking the absolute value of the difference between the price data and the moving average, divided by the product of the standard deviation and the multiplier.
Interpretation:
Direction: The position of the long and short lines at the top indicates the direction of the ticker. Long line for long position and Short line for short position.
Strength: When the Strength line is below the directional lines, it is a weak trend or consolidating. If it stays in between the two directional lines, it is a strong trend.
릴리즈 노트
I updated the name in the description to reflect that with the code.오픈 소스 스크립트
트레이딩뷰의 진정한 정신에 따라, 이 스크립트의 작성자는 이를 오픈소스로 공개하여 트레이더들이 기능을 검토하고 검증할 수 있도록 했습니다. 작성자에게 찬사를 보냅니다! 이 코드는 무료로 사용할 수 있지만, 코드를 재게시하는 경우 하우스 룰이 적용된다는 점을 기억하세요.
면책사항
해당 정보와 게시물은 금융, 투자, 트레이딩 또는 기타 유형의 조언이나 권장 사항으로 간주되지 않으며, 트레이딩뷰에서 제공하거나 보증하는 것이 아닙니다. 자세한 내용은 이용 약관을 참조하세요.
오픈 소스 스크립트
트레이딩뷰의 진정한 정신에 따라, 이 스크립트의 작성자는 이를 오픈소스로 공개하여 트레이더들이 기능을 검토하고 검증할 수 있도록 했습니다. 작성자에게 찬사를 보냅니다! 이 코드는 무료로 사용할 수 있지만, 코드를 재게시하는 경우 하우스 룰이 적용된다는 점을 기억하세요.
면책사항
해당 정보와 게시물은 금융, 투자, 트레이딩 또는 기타 유형의 조언이나 권장 사항으로 간주되지 않으며, 트레이딩뷰에서 제공하거나 보증하는 것이 아닙니다. 자세한 내용은 이용 약관을 참조하세요.