INVITE-ONLY SCRIPT
업데이트됨 Smartgrow Trading - Visual Series - Cryptoball
Welcome to our Tradingview buy signal indicator with visual support.
We develop signals which have been specially developed for crypto trading bots. We will publish new indicators at regular intervals.
At the moment our all-in-one indicator includes the following indicators:
- "Crypto Bot Signal 01 - Optimized RSI Momentum"
- "Trading Bot Buy Signal 02 - MTF Stochastic"
- "Trading Bot Buy Signal 03 - MTF StochRSI"
- "Smartgrow Trading - Bearish Power Signals"
The basic idea of this all-in-one indicator is to decrease the needed number of alarms and to provide an all-in-one script for our users trading long direction only. We only include indicators which are relatively robust against false breakouts, even if these can of course never be avoided. These signals alone occur relatively rare, but you can set an alarm up on different pairs simultaneously. The strategy can only be used in 5 min chart and in crypto pairs. It wasnt tested in Forex etc. but feel free to test it.
The main idea behind the signals is to identify strong oversold areas as these have great potential to move in the other direction again. To determine this, we use custom oversold indicators to create buy signals. You could automate these buy signals but we suggest to use these instructions instead:
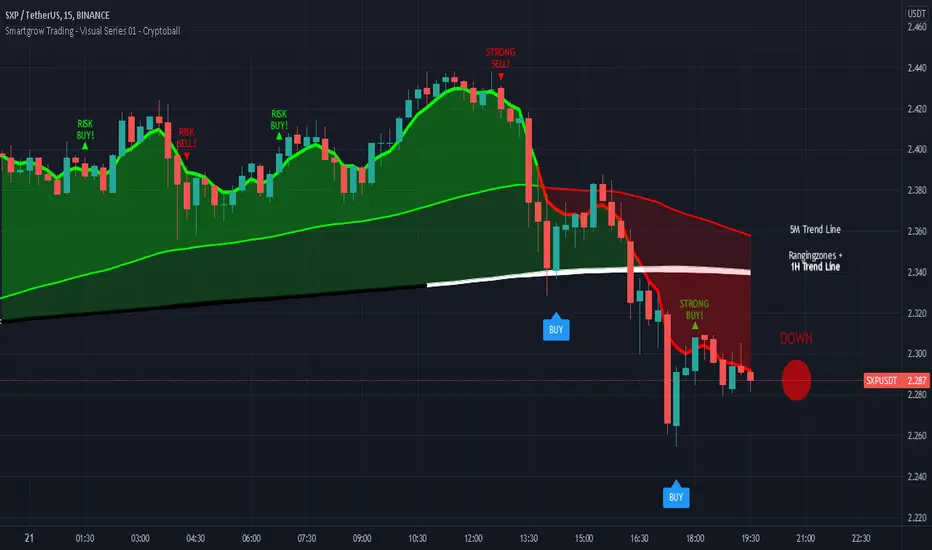
If an alarm is triggered it is showing points with a strong reversal chance for long signals. We recommend watching the chart closely and finding a good entry point. For visual support, we have visualized the basic trend in color on the one hand. If the 5 minute trend line is above the 1 hour trend line , then there is an upward trend which is marked with a corresponding note. If the 5 minute trend line is below the 1 hour trendline, then there is a downward trend. If you only want to look at the trend line of the 5 minute chart, deactivate the 1 hour trendline in the settings. When the 5 period Exponential Moving Average is higher then the 90 period Exponential Moving Average then the area between them is colored in green, otherwise in red. The same is the case when the 5 period Exponential Moving Average is higher then the 1 hour trendline.
As a second visual support, we have marked volatile zones in the market with the colors black and white. The color black generally denotes a market with low volatility and entry into these areas is therefore not recommended or involves risks. To show potential entry points based on market momentum we added note signs showing either buy or sell spots based on crossovers. If a crossover is within an area of low volatility we marked it as risk buy. if a crossover is within an area of higher volatility we marked it as a strong buy.
To find a good point to exit a trade we added also note signs showing possible sell spots. When these occure an crossover in momentum has allready occured and a potential trend reserval may occur. You could also use this indicator in combination with oversold indicators like RSI or Stochastic to see potential reversal spots when a market is oversold. As a last helper we implemented the Cryptoball on the right side of the chart to vizualize the currently price movement. Therefore it is looking only a few candles back to show you the smoothed price direction. When the color of the indicator is switching from green to red it is a sign that a smaller price drop may occure amd indicates a possible sell.
We sell this indicator so it is invite only. But of cause you can test the single indicators before buying.
If there are questions, write them into the comments or contact us directly over the direct message. Happy Trading!
We develop signals which have been specially developed for crypto trading bots. We will publish new indicators at regular intervals.
At the moment our all-in-one indicator includes the following indicators:
- "Crypto Bot Signal 01 - Optimized RSI Momentum"
- "Trading Bot Buy Signal 02 - MTF Stochastic"
- "Trading Bot Buy Signal 03 - MTF StochRSI"
- "Smartgrow Trading - Bearish Power Signals"
The basic idea of this all-in-one indicator is to decrease the needed number of alarms and to provide an all-in-one script for our users trading long direction only. We only include indicators which are relatively robust against false breakouts, even if these can of course never be avoided. These signals alone occur relatively rare, but you can set an alarm up on different pairs simultaneously. The strategy can only be used in 5 min chart and in crypto pairs. It wasnt tested in Forex etc. but feel free to test it.
The main idea behind the signals is to identify strong oversold areas as these have great potential to move in the other direction again. To determine this, we use custom oversold indicators to create buy signals. You could automate these buy signals but we suggest to use these instructions instead:
If an alarm is triggered it is showing points with a strong reversal chance for long signals. We recommend watching the chart closely and finding a good entry point. For visual support, we have visualized the basic trend in color on the one hand. If the 5 minute trend line is above the 1 hour trend line , then there is an upward trend which is marked with a corresponding note. If the 5 minute trend line is below the 1 hour trendline, then there is a downward trend. If you only want to look at the trend line of the 5 minute chart, deactivate the 1 hour trendline in the settings. When the 5 period Exponential Moving Average is higher then the 90 period Exponential Moving Average then the area between them is colored in green, otherwise in red. The same is the case when the 5 period Exponential Moving Average is higher then the 1 hour trendline.
As a second visual support, we have marked volatile zones in the market with the colors black and white. The color black generally denotes a market with low volatility and entry into these areas is therefore not recommended or involves risks. To show potential entry points based on market momentum we added note signs showing either buy or sell spots based on crossovers. If a crossover is within an area of low volatility we marked it as risk buy. if a crossover is within an area of higher volatility we marked it as a strong buy.
To find a good point to exit a trade we added also note signs showing possible sell spots. When these occure an crossover in momentum has allready occured and a potential trend reserval may occur. You could also use this indicator in combination with oversold indicators like RSI or Stochastic to see potential reversal spots when a market is oversold. As a last helper we implemented the Cryptoball on the right side of the chart to vizualize the currently price movement. Therefore it is looking only a few candles back to show you the smoothed price direction. When the color of the indicator is switching from green to red it is a sign that a smaller price drop may occure amd indicates a possible sell.
We sell this indicator so it is invite only. But of cause you can test the single indicators before buying.
If there are questions, write them into the comments or contact us directly over the direct message. Happy Trading!
릴리즈 노트
Updating the labels of the buy and sell signals릴리즈 노트
Updated wrong plot of risk sell초대 전용 스크립트
이 스크립트는 작성자가 승인한 사용자만 접근할 수 있습니다. 사용하려면 요청 후 승인을 받아야 하며, 일반적으로 결제 후에 허가가 부여됩니다. 자세한 내용은 아래 작성자의 안내를 따르거나 Smartgrow-Trading에게 직접 문의하세요.
트레이딩뷰는 스크립트의 작동 방식을 충분히 이해하고 작성자를 완전히 신뢰하지 않는 이상, 해당 스크립트에 비용을 지불하거나 사용하는 것을 권장하지 않습니다. 커뮤니티 스크립트에서 무료 오픈소스 대안을 찾아보실 수도 있습니다.
작성자 지시 사항
You can ask for access to this indicator by contacting us via e-Mail: info@smartgrow-trading.com
면책사항
해당 정보와 게시물은 금융, 투자, 트레이딩 또는 기타 유형의 조언이나 권장 사항으로 간주되지 않으며, 트레이딩뷰에서 제공하거나 보증하는 것이 아닙니다. 자세한 내용은 이용 약관을 참조하세요.
초대 전용 스크립트
이 스크립트는 작성자가 승인한 사용자만 접근할 수 있습니다. 사용하려면 요청 후 승인을 받아야 하며, 일반적으로 결제 후에 허가가 부여됩니다. 자세한 내용은 아래 작성자의 안내를 따르거나 Smartgrow-Trading에게 직접 문의하세요.
트레이딩뷰는 스크립트의 작동 방식을 충분히 이해하고 작성자를 완전히 신뢰하지 않는 이상, 해당 스크립트에 비용을 지불하거나 사용하는 것을 권장하지 않습니다. 커뮤니티 스크립트에서 무료 오픈소스 대안을 찾아보실 수도 있습니다.
작성자 지시 사항
You can ask for access to this indicator by contacting us via e-Mail: info@smartgrow-trading.com
면책사항
해당 정보와 게시물은 금융, 투자, 트레이딩 또는 기타 유형의 조언이나 권장 사항으로 간주되지 않으며, 트레이딩뷰에서 제공하거나 보증하는 것이 아닙니다. 자세한 내용은 이용 약관을 참조하세요.