OPEN-SOURCE SCRIPT
Pipe tops & bottoms v1.0
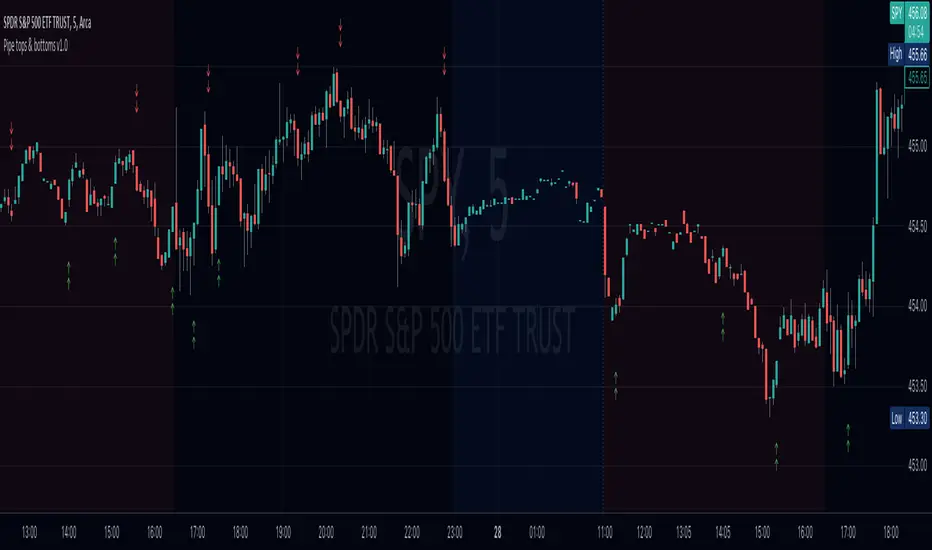
This indicator detects Pipe Tops and Pipe Bottoms chart patterns, using the concept described by Thomas Bulkowski: Tops, Bottoms.
Pipe tops and bottoms patterns are marked on the chart. You can change the indicator sensitivity by using the main settings which define detected price variation boundaries. This will lead to more dense or sparse pattern detection.
Once the bar following each detected top or bottom pattern satisfies signal condition (the current close price must be higher than the high of the pipe bottom, or lower than the low of the pipe top), these bars are also marked on the chart and can be used to define potential long or short entry points.
You can optionally choose to show only signal marks on the chart (this is preferable to avoid visual cluttering), or both pattern and signal marks.
Script calculations are based on the 'Pipe Bottoms Indicator Based on Thomas Bulkowski's Theories' indicator developed by BoilderRoomColdCaller in 2020.
오픈 소스 스크립트
트레이딩뷰의 진정한 정신에 따라, 이 스크립트의 작성자는 이를 오픈소스로 공개하여 트레이더들이 기능을 검토하고 검증할 수 있도록 했습니다. 작성자에게 찬사를 보냅니다! 이 코드는 무료로 사용할 수 있지만, 코드를 재게시하는 경우 하우스 룰이 적용된다는 점을 기억하세요.
면책사항
해당 정보와 게시물은 금융, 투자, 트레이딩 또는 기타 유형의 조언이나 권장 사항으로 간주되지 않으며, 트레이딩뷰에서 제공하거나 보증하는 것이 아닙니다. 자세한 내용은 이용 약관을 참조하세요.
오픈 소스 스크립트
트레이딩뷰의 진정한 정신에 따라, 이 스크립트의 작성자는 이를 오픈소스로 공개하여 트레이더들이 기능을 검토하고 검증할 수 있도록 했습니다. 작성자에게 찬사를 보냅니다! 이 코드는 무료로 사용할 수 있지만, 코드를 재게시하는 경우 하우스 룰이 적용된다는 점을 기억하세요.
면책사항
해당 정보와 게시물은 금융, 투자, 트레이딩 또는 기타 유형의 조언이나 권장 사항으로 간주되지 않으며, 트레이딩뷰에서 제공하거나 보증하는 것이 아닙니다. 자세한 내용은 이용 약관을 참조하세요.