OPEN-SOURCE SCRIPT
APC Companion – Volume Accumulation/Distribution
Indicator Description (TradingView – Open Source)
APC Companion – Volume Accumulation/Distribution Filter
(Designed to work standalone or together with the APC Compass)
What this indicator does
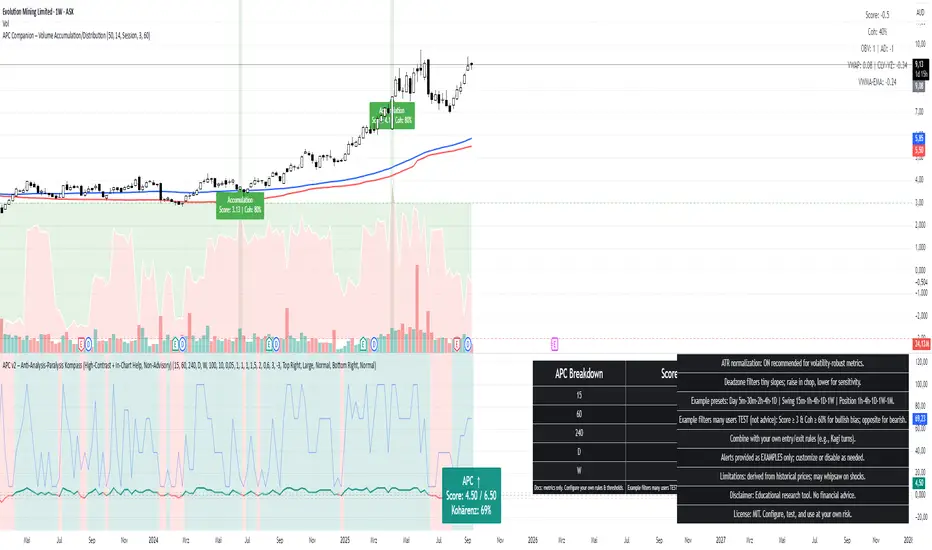
The APC Companion measures whether markets are under Accumulation (buying pressure) or Distribution (selling pressure) by combining:
Chaikin A/D slope – volume flow into price moves
On-Balance Volume momentum – confirms trend strength
VWAP spread – price vs. fair value by traded volume
CLV × Volume Z-Score – detects intrabar absorption / selling pressure
VWMA vs. EMA100 – confirms whether weighted volume supports price action
The result is a single Acc/Dist Score (−5 … +5) and a Coherence % showing how many signals agree.
How to interpret
Score ≥ +3 & Coherence ≥ 60% → Accumulation (green) → market supported by buyers
Score ≤ −3 & Coherence ≥ 60% → Distribution (red) → market pressured by sellers
Anything in between = neutral (no strong bias)
Using with APC Compass
Long trades: Only take Compass Long signals when Companion shows Accumulation.
Short trades: Only take Compass Short signals when Companion shows Distribution.
Neutral Companion: Skip or reduce size if there is no confirmation.
This filter greatly reduces false signals and improves trade quality.
Best practice
Swing trading: 4H / 1D charts, lenZ 40–80, lenSlope 14–20
Intraday: 5m–30m charts, lenZ 20–30, lenSlope 10–14
Position sizing: Increase with higher Coherence %, reduce when below 60%
Exits: Reduce or close if Score drops back to neutral or flips opposite
Disclaimer
This script is published open source for educational purposes only.
It is not financial advice. Test thoroughly before using in live trading.
APC Companion – Volume Accumulation/Distribution Filter
(Designed to work standalone or together with the APC Compass)
What this indicator does
The APC Companion measures whether markets are under Accumulation (buying pressure) or Distribution (selling pressure) by combining:
Chaikin A/D slope – volume flow into price moves
On-Balance Volume momentum – confirms trend strength
VWAP spread – price vs. fair value by traded volume
CLV × Volume Z-Score – detects intrabar absorption / selling pressure
VWMA vs. EMA100 – confirms whether weighted volume supports price action
The result is a single Acc/Dist Score (−5 … +5) and a Coherence % showing how many signals agree.
How to interpret
Score ≥ +3 & Coherence ≥ 60% → Accumulation (green) → market supported by buyers
Score ≤ −3 & Coherence ≥ 60% → Distribution (red) → market pressured by sellers
Anything in between = neutral (no strong bias)
Using with APC Compass
Long trades: Only take Compass Long signals when Companion shows Accumulation.
Short trades: Only take Compass Short signals when Companion shows Distribution.
Neutral Companion: Skip or reduce size if there is no confirmation.
This filter greatly reduces false signals and improves trade quality.
Best practice
Swing trading: 4H / 1D charts, lenZ 40–80, lenSlope 14–20
Intraday: 5m–30m charts, lenZ 20–30, lenSlope 10–14
Position sizing: Increase with higher Coherence %, reduce when below 60%
Exits: Reduce or close if Score drops back to neutral or flips opposite
Disclaimer
This script is published open source for educational purposes only.
It is not financial advice. Test thoroughly before using in live trading.
오픈 소스 스크립트
트레이딩뷰의 진정한 정신에 따라, 이 스크립트의 작성자는 이를 오픈소스로 공개하여 트레이더들이 기능을 검토하고 검증할 수 있도록 했습니다. 작성자에게 찬사를 보냅니다! 이 코드는 무료로 사용할 수 있지만, 코드를 재게시하는 경우 하우스 룰이 적용된다는 점을 기억하세요.
면책사항
해당 정보와 게시물은 금융, 투자, 트레이딩 또는 기타 유형의 조언이나 권장 사항으로 간주되지 않으며, 트레이딩뷰에서 제공하거나 보증하는 것이 아닙니다. 자세한 내용은 이용 약관을 참조하세요.
오픈 소스 스크립트
트레이딩뷰의 진정한 정신에 따라, 이 스크립트의 작성자는 이를 오픈소스로 공개하여 트레이더들이 기능을 검토하고 검증할 수 있도록 했습니다. 작성자에게 찬사를 보냅니다! 이 코드는 무료로 사용할 수 있지만, 코드를 재게시하는 경우 하우스 룰이 적용된다는 점을 기억하세요.
면책사항
해당 정보와 게시물은 금융, 투자, 트레이딩 또는 기타 유형의 조언이나 권장 사항으로 간주되지 않으며, 트레이딩뷰에서 제공하거나 보증하는 것이 아닙니다. 자세한 내용은 이용 약관을 참조하세요.