OPEN-SOURCE SCRIPT
업데이트됨 ICT IPDA Look Back
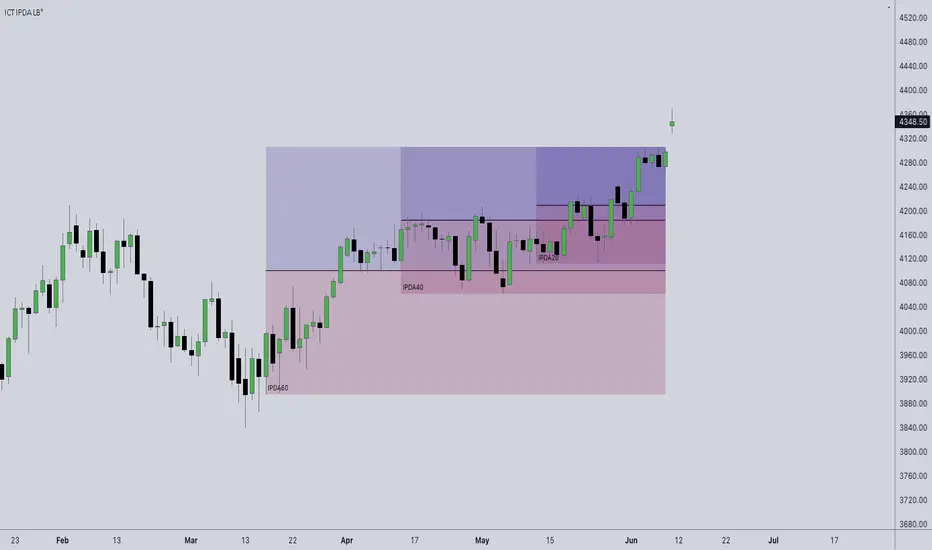
This script automatically calculates and updates ICT's daily IPDA look back time intervals and their respective discount / equilibrium / premium, so you don't have to :)
IPDA stands for Interbank Price Delivery Algorithm. Said algorithm appears to be referencing the past 20, 40, and 60 days intervals as points of reference to define ranges and related PD arrays.
Intraday traders can find most value in the 20 Day Look Back box, by observing imbalances and points of interest.
Longer term traders can reference the 40 and 60 Day Look Back boxes for a clear indication of current market conditions.
릴리즈 노트
v0.0 - Chart update.릴리즈 노트
v0.1 - Added different ways of displaying the location of price inside the IPDA ranges:> 'Boxes' shows the proper IPDA ranges, plotting boxes on the chart;
> 'Table A' shows whether price is in Discount of Premium for each of the IPDA ranges;
> 'Table B' shows the distance from Equilibrium in percentage or each of the IPDA ranges.
릴리즈 노트
v0.2 - 'Table B' shows the location of price in percentage for each of the IPDA ranges, where 0% is deep Discount and 100% is high Premium.릴리즈 노트
- Bug Fix: boxes were displaying on lower timeframes. Restricted to 1D chart.릴리즈 노트
Bug Fix: IPDA Low and High was not checking the 20th, 40th and 60th candle.Cosmetics: Added a Line for Equilibrium instead of using the boxes for better visualization and customization.
릴리즈 노트
Major Features Added: – Plot Daily IPDA Data Ranges on any LTF
– Plot LTF IPDA Data Ranges (last 20, 40, 60 LTF candles)
릴리즈 노트
Bug Fix: resolved all issues with boxes plots from previous update!릴리즈 노트
Bug Fix: now plotting from previous day.릴리즈 노트
Fixed Bar Count릴리즈 노트
Added Alerts오픈 소스 스크립트
트레이딩뷰의 진정한 정신에 따라, 이 스크립트의 작성자는 이를 오픈소스로 공개하여 트레이더들이 기능을 검토하고 검증할 수 있도록 했습니다. 작성자에게 찬사를 보냅니다! 이 코드는 무료로 사용할 수 있지만, 코드를 재게시하는 경우 하우스 룰이 적용된다는 점을 기억하세요.
homo faber fortunæ suæ
면책사항
해당 정보와 게시물은 금융, 투자, 트레이딩 또는 기타 유형의 조언이나 권장 사항으로 간주되지 않으며, 트레이딩뷰에서 제공하거나 보증하는 것이 아닙니다. 자세한 내용은 이용 약관을 참조하세요.
오픈 소스 스크립트
트레이딩뷰의 진정한 정신에 따라, 이 스크립트의 작성자는 이를 오픈소스로 공개하여 트레이더들이 기능을 검토하고 검증할 수 있도록 했습니다. 작성자에게 찬사를 보냅니다! 이 코드는 무료로 사용할 수 있지만, 코드를 재게시하는 경우 하우스 룰이 적용된다는 점을 기억하세요.
homo faber fortunæ suæ
면책사항
해당 정보와 게시물은 금융, 투자, 트레이딩 또는 기타 유형의 조언이나 권장 사항으로 간주되지 않으며, 트레이딩뷰에서 제공하거나 보증하는 것이 아닙니다. 자세한 내용은 이용 약관을 참조하세요.