OPEN-SOURCE SCRIPT
업데이트됨 AI Infinity

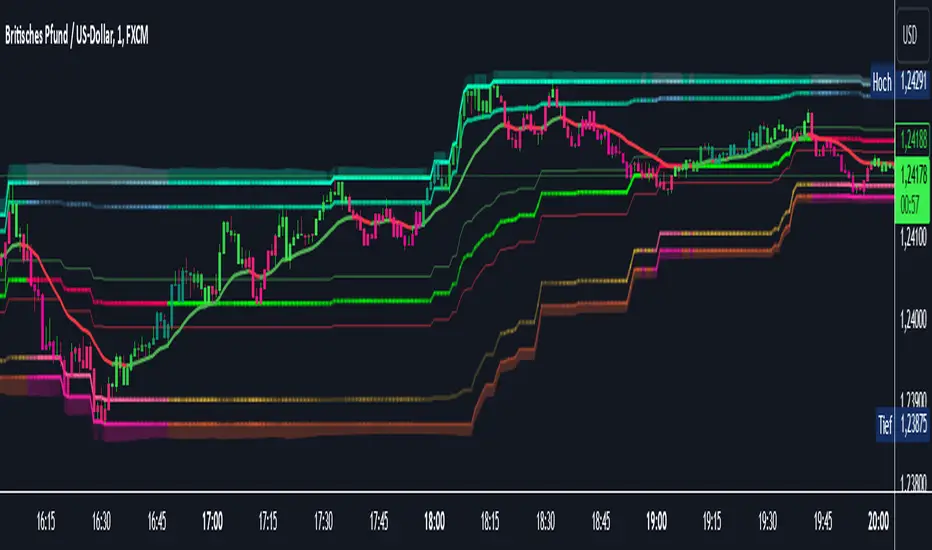
AI Infinity – Multidimensional Market Analysis
Overview
The AI Infinity indicator combines multiple analysis tools into a single solution. Alongside dynamic candle coloring based on MACD and Stochastic signals, it features Alligator lines, several RSI lines (including glow effects), and optionally enabled EMAs (20/50, 100, and 200). Every module is individually configurable, allowing traders to tailor the indicator to their personal style and strategy.
Important Note (Disclaimer)
Functionality & Components
1. Candle Coloring (MACD & Stochastic)
2. Alligator Lines
3. RSI Lines & Glow Effects
4. Optional EMAs (20/50, 100, 200)
Configuration Options
Example Use Cases
Overview
The AI Infinity indicator combines multiple analysis tools into a single solution. Alongside dynamic candle coloring based on MACD and Stochastic signals, it features Alligator lines, several RSI lines (including glow effects), and optionally enabled EMAs (20/50, 100, and 200). Every module is individually configurable, allowing traders to tailor the indicator to their personal style and strategy.
Important Note (Disclaimer)
- This indicator is provided for educational and informational purposes only.
- It does not constitute financial or investment advice and offers no guarantee of profit.
- Each trader is responsible for their own trading decisions.
- Past performance does not guarantee future results.
- Please review the settings thoroughly and adjust them to your personal risk profile; consider supplementary analyses or professional guidance where appropriate.
Functionality & Components
1. Candle Coloring (MACD & Stochastic)
- Objective: Provide an immediate visual snapshot of the market’s condition.
- Details:
- MACD Signal: Used to identify bullish and bearish momentum.
- Stochastic: Detects overbought and oversold zones.
- Color Modes: Offers both a simple (two-color) mode and a gradient mode.
2. Alligator Lines
- Objective: Assist with trend analysis and determining the market’s current phase.
- Details:
- Dynamic SMMA Lines (Jaw, Teeth, Lips) that adjust based on volatility and market conditions.
- Multiple Lengths: Each element uses a separate smoothing period (13, 8, 5).
- Transparency: You can show or hide each line independently.
3. RSI Lines & Glow Effects
- Objective: Display the RSI values directly on the price chart so critical levels (e.g., 20, 50, 80) remain visible at a glance.
- Details:
- RSI Scaling: The RSI is plotted in the chart window, eliminating the need to switch panels.
- Dynamic Transparency: A pulse effect indicates when the RSI is near critical thresholds.
- Glow Mode: Choose between “Direct Glow” or “Dynamic Transparency” (based on ATR distance).
- Custom RSI Length: Freely adjustable (default is 14).
4. Optional EMAs (20/50, 100, 200)
- Objective: Utilize moving averages for trend assessment and identifying potential support/resistance areas.
- Details:
- 20/50 EMA: Select which one to display via a dropdown menu.
- 100 EMA & 200 EMA: Independently enabled.
- Color Logic: Automatically green (price > EMA) or red (price < EMA). Each EMA’s up/down color is customizable.
Configuration Options
- Candle Coloring:
- Choose between Gradient or Simple mode.
- Adjust the color scheme for bullish/bearish candles.
- Transparency is dynamically based on candle body size and Stochastic state.
- Alligator Lines:
- Toggle each line (Jaw/Teeth/Lips) on or off.
- Select individual colors for each line.
- RSI Section:
- RSI Length can be set as desired.
- RSI lines (0, 20, 50, 80, 100) with user-defined colors and transparency (pulse effect).
- Additional lines (e.g., RSI 40/60) are also available.
- Glow Effects:
- Switch between “Dynamic Transparency” (ATR-based) and “Direct Glow”.
- Independently applied to the RSI 100 and RSI 0 lines.
- EMAs (20/50, 100, 200):
- Activate each one as needed.
- Each EMA’s up/down color can be customized.
Example Use Cases
- Trend Identification:
- Enable Alligator lines to gauge general trend direction through SMMA signals.
- Timing:
- Watch the Candle Colors to spot potential overbought or oversold conditions.
- Fine-Tuning:
- Utilize the RSI lines to closely monitor important thresholds (50 as a trend barometer, 80/20 as possible reversal zones).
- Filtering:
- Enable a 50 EMA to quickly see if the market is trading above (bullish) or below (bearish) it.
릴리즈 노트
Short Alert Description:These alerts notify you of potential market signals based on MACD and RSI conditions:
- Bullish MACD Cross: The MACD line crosses above the Signal line (possible bullish momentum).
- Bearish MACD Cross: The MACD line crosses below the Signal line (possible bearish momentum).
- RSI Cross Above 80: RSI crosses from below 80 to above 80 (potential overbought zone).
- RSI Cross Below 20: RSI crosses from above 20 to below 20 (potential oversold zone).
Use these alerts to keep track of major momentum shifts and potential trend reversals.
릴리즈 노트
New update with adjustable ATR length for glow calculations and flexible color choices for dynamic mode or direct glow The clamp function and glow logic remain the same yet are now customizable in the settings오픈 소스 스크립트
트레이딩뷰의 진정한 정신에 따라, 이 스크립트의 작성자는 이를 오픈소스로 공개하여 트레이더들이 기능을 검토하고 검증할 수 있도록 했습니다. 작성자에게 찬사를 보냅니다! 이 코드는 무료로 사용할 수 있지만, 코드를 재게시하는 경우 하우스 룰이 적용된다는 점을 기억하세요.
면책사항
해당 정보와 게시물은 금융, 투자, 트레이딩 또는 기타 유형의 조언이나 권장 사항으로 간주되지 않으며, 트레이딩뷰에서 제공하거나 보증하는 것이 아닙니다. 자세한 내용은 이용 약관을 참조하세요.
오픈 소스 스크립트
트레이딩뷰의 진정한 정신에 따라, 이 스크립트의 작성자는 이를 오픈소스로 공개하여 트레이더들이 기능을 검토하고 검증할 수 있도록 했습니다. 작성자에게 찬사를 보냅니다! 이 코드는 무료로 사용할 수 있지만, 코드를 재게시하는 경우 하우스 룰이 적용된다는 점을 기억하세요.
면책사항
해당 정보와 게시물은 금융, 투자, 트레이딩 또는 기타 유형의 조언이나 권장 사항으로 간주되지 않으며, 트레이딩뷰에서 제공하거나 보증하는 것이 아닙니다. 자세한 내용은 이용 약관을 참조하세요.