OPEN-SOURCE SCRIPT
MAGIC MA BANDS
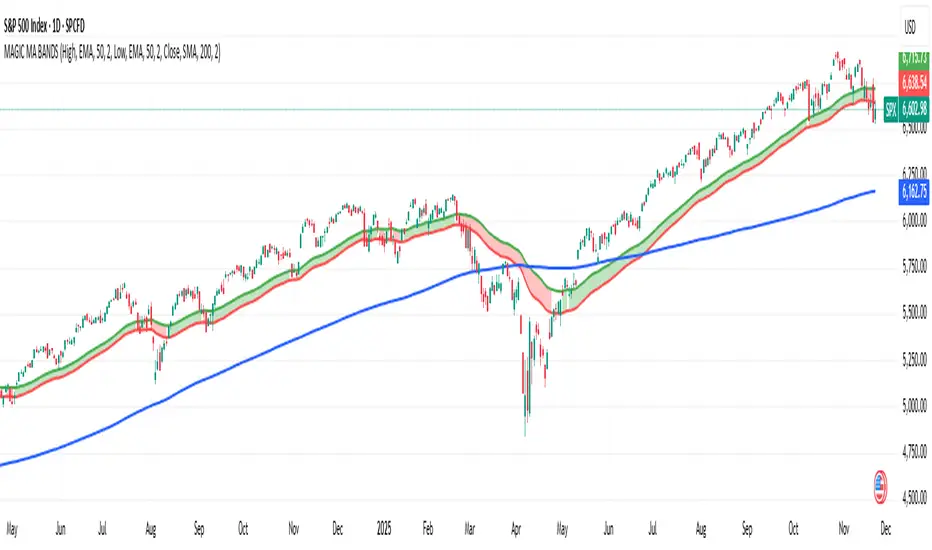
Magic MA Bands — Dynamic Trend Zones Instead of Lines
Magic MA Bands help traders visualize dynamic support and resistance zones rather than relying on a single moving average line. Instead of treating the MA as an exact reaction level, this tool creates a band or zone where price is statistically more likely to react, reverse, or continue trending.
🧠 How It Works
The script plots:
Upper Band (default: 50 EMA using High values)
Lower Band (default: 50 EMA using Low values)
Optional Midline MA (default: 200 SMA for long-term trend)
The area between the upper and lower bands becomes a trend cushion, helping traders identify:
Dynamic support/resistance zones
Trend strength and continuation probability
Ideal pullback entry regions
🎯 Trend Interpretation Guide
Use Case Recommended Setting
Short-Term Trend 20/21 EMA or SMA
Medium-Term Trend 50 EMA / SMA
Long-Term Trend 200 SMA / EMA (Midline Optional)
All parameters are fully customisable so the user can define their preferred structure based on their trading style, asset volatility, or timeframe.
✔️ Best For:
Trend traders
Swing trading
Pullback-based entries
Institutional-style zone analysis
오픈 소스 스크립트
트레이딩뷰의 진정한 정신에 따라, 이 스크립트의 작성자는 이를 오픈소스로 공개하여 트레이더들이 기능을 검토하고 검증할 수 있도록 했습니다. 작성자에게 찬사를 보냅니다! 이 코드는 무료로 사용할 수 있지만, 코드를 재게시하는 경우 하우스 룰이 적용된다는 점을 기억하세요.
면책사항
해당 정보와 게시물은 금융, 투자, 트레이딩 또는 기타 유형의 조언이나 권장 사항으로 간주되지 않으며, 트레이딩뷰에서 제공하거나 보증하는 것이 아닙니다. 자세한 내용은 이용 약관을 참조하세요.
오픈 소스 스크립트
트레이딩뷰의 진정한 정신에 따라, 이 스크립트의 작성자는 이를 오픈소스로 공개하여 트레이더들이 기능을 검토하고 검증할 수 있도록 했습니다. 작성자에게 찬사를 보냅니다! 이 코드는 무료로 사용할 수 있지만, 코드를 재게시하는 경우 하우스 룰이 적용된다는 점을 기억하세요.
면책사항
해당 정보와 게시물은 금융, 투자, 트레이딩 또는 기타 유형의 조언이나 권장 사항으로 간주되지 않으며, 트레이딩뷰에서 제공하거나 보증하는 것이 아닙니다. 자세한 내용은 이용 약관을 참조하세요.