OPEN-SOURCE SCRIPT
Trend Finder
A Trend Finder is a specialized indicator designed to analyze market trends by combining pivot points and candlestick patterns. This hybrid approach aims to provide more accurate signals for identifying potential market directions. Here's a refined description of its features and usage:
**Overview:**
A Trend Finder indicator utilizes a combination of pivot points and candlestick patterns to offer insights into the prevailing market trend. By incorporating both elements, it seeks to enhance the accuracy of trend analysis.
**How to Use Trend Finder:**
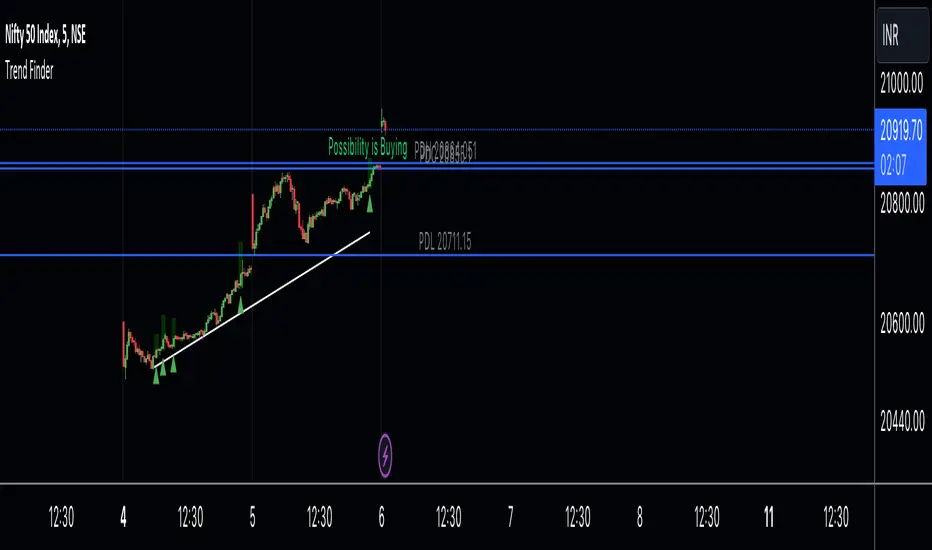
Using the Trend Finder is straightforward and involves interpreting the signals provided by different coloured boxes:
1. **Green Box (Bull Box):**
- Indicates a potential uptrend in the market.
- Highlights possible market direction and key points.
- Offers insights into bullish market conditions.
2. **Red Box (Downtrend Box):**
- Signals a potential downtrend in the market.
- Illustrates possible downward market direction and pivotal points.
- Provides an estimate of potential market decline using pivot point calculations.
**Customization Options:**
The Trend Finder comes with customization options to tailor the analysis based on candlestick patterns. Users can adjust these settings to refine the accuracy of trend identification.
**Additional Features:**
The indicator includes extra features to enhance its functionality:
- Displays the previous day's high, low, and close values.
- Utilizes this historical data to suggest potential trend directions.
- Enables users to make informed trading decisions based on past market behaviour.
**Usage Guidelines:**
Traders can use the Trend Finder by observing the signals within the coloured boxes, considering the pivot point calculations, and factoring in candlestick patterns. The indicator's flexibility allows users to adjust settings to better align with their preferred trading strategies.
In essence, the Trend Finder serves as a comprehensive tool for traders seeking a nuanced understanding of market trends. By combining pivotal technical indicators, it aims to provide a more accurate depiction of potential market movements, assisting traders in making informed decisions.
**Overview:**
A Trend Finder indicator utilizes a combination of pivot points and candlestick patterns to offer insights into the prevailing market trend. By incorporating both elements, it seeks to enhance the accuracy of trend analysis.
**How to Use Trend Finder:**
Using the Trend Finder is straightforward and involves interpreting the signals provided by different coloured boxes:
1. **Green Box (Bull Box):**
- Indicates a potential uptrend in the market.
- Highlights possible market direction and key points.
- Offers insights into bullish market conditions.
2. **Red Box (Downtrend Box):**
- Signals a potential downtrend in the market.
- Illustrates possible downward market direction and pivotal points.
- Provides an estimate of potential market decline using pivot point calculations.
**Customization Options:**
The Trend Finder comes with customization options to tailor the analysis based on candlestick patterns. Users can adjust these settings to refine the accuracy of trend identification.
**Additional Features:**
The indicator includes extra features to enhance its functionality:
- Displays the previous day's high, low, and close values.
- Utilizes this historical data to suggest potential trend directions.
- Enables users to make informed trading decisions based on past market behaviour.
**Usage Guidelines:**
Traders can use the Trend Finder by observing the signals within the coloured boxes, considering the pivot point calculations, and factoring in candlestick patterns. The indicator's flexibility allows users to adjust settings to better align with their preferred trading strategies.
In essence, the Trend Finder serves as a comprehensive tool for traders seeking a nuanced understanding of market trends. By combining pivotal technical indicators, it aims to provide a more accurate depiction of potential market movements, assisting traders in making informed decisions.
오픈 소스 스크립트
트레이딩뷰의 진정한 정신에 따라, 이 스크립트의 작성자는 이를 오픈소스로 공개하여 트레이더들이 기능을 검토하고 검증할 수 있도록 했습니다. 작성자에게 찬사를 보냅니다! 이 코드는 무료로 사용할 수 있지만, 코드를 재게시하는 경우 하우스 룰이 적용된다는 점을 기억하세요.
면책사항
해당 정보와 게시물은 금융, 투자, 트레이딩 또는 기타 유형의 조언이나 권장 사항으로 간주되지 않으며, 트레이딩뷰에서 제공하거나 보증하는 것이 아닙니다. 자세한 내용은 이용 약관을 참조하세요.
오픈 소스 스크립트
트레이딩뷰의 진정한 정신에 따라, 이 스크립트의 작성자는 이를 오픈소스로 공개하여 트레이더들이 기능을 검토하고 검증할 수 있도록 했습니다. 작성자에게 찬사를 보냅니다! 이 코드는 무료로 사용할 수 있지만, 코드를 재게시하는 경우 하우스 룰이 적용된다는 점을 기억하세요.
면책사항
해당 정보와 게시물은 금융, 투자, 트레이딩 또는 기타 유형의 조언이나 권장 사항으로 간주되지 않으며, 트레이딩뷰에서 제공하거나 보증하는 것이 아닙니다. 자세한 내용은 이용 약관을 참조하세요.