INVITE-ONLY SCRIPT
업데이트됨 Seasonalities Pro
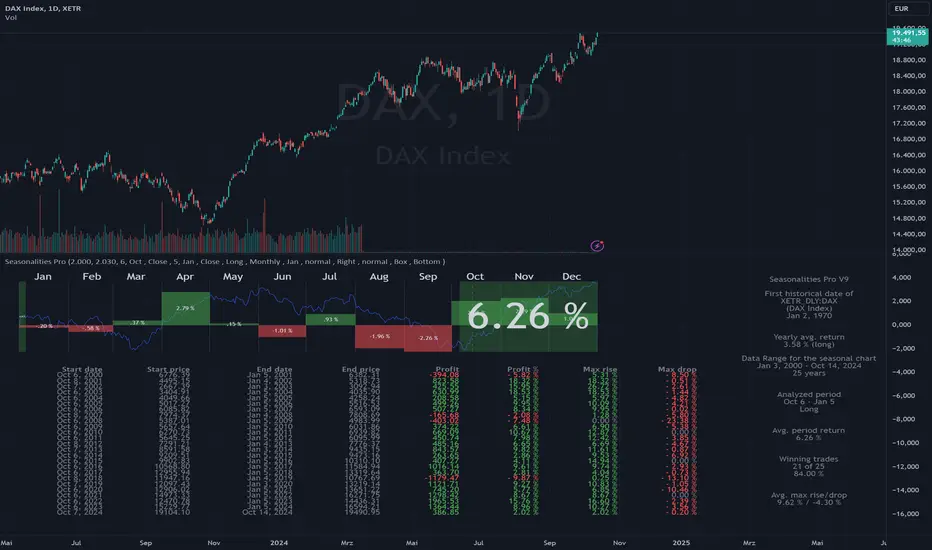
Seasonalities Pro indicator for TradingView - identify, evaluate and exploit seasonal patterns
Differences between Lite and Pro
Pro: Evaluation of all symbols available at TradingView up to 40 years in the past.
Lite: Like Pro, but only "DAX", "SPX" and "NDX" up to 40 years in the past, all other symbols 5 years.
Der Seasonalities Pro Indikator für TradingView – saisonale Muster erkennen, auswerten und nutzen
Unterschiede zwischen Lite und Pro
Pro: Auswertung aller bei TradingView verfügbaren Symbole bis zu 40 Jahre in die Vergangenheit
Lite: Wie Pro, jedoch nur "DAX", "SPX" und "NDX" bis zu 40 Jahre in die Vergangenheit, alle anderen Symbole 5 Jahre.
- Identification of seasonal investment opportunities
- Easy to use without prior knowledge with just a few clicks
- Statistical evaluation over an adjustable data basis (5 to 40 years)
- Period to be considered also across year boundaries
- Applicable to all instruments/symbols (indices, stocks, commodities, currencies, cryptos) that TradingView provides
- Best price/performance ratio
Differences between Lite and Pro
Pro: Evaluation of all symbols available at TradingView up to 40 years in the past.
Lite: Like Pro, but only "DAX", "SPX" and "NDX" up to 40 years in the past, all other symbols 5 years.
Der Seasonalities Pro Indikator für TradingView – saisonale Muster erkennen, auswerten und nutzen
- Identifizierung von saisonalen Investmentmöglichkeiten
- Einfache Anwendung ohne Vorkenntnisse mit wenigen Klicks
- Statistische Auswertung über eine einstellbare Datenbasis (5 bis 40 Jahre)
- Zu betrachtende Periode auch über die Jahresgrenze hinweg
- Anwendbar auf alle Instrumente/Symbole (Indizes, Aktien, Rohstoffe, Währungen, Cryptos) die TradingView zur Verfügung stellt
- Bestes Preis-/Leistungsverhältnis
Unterschiede zwischen Lite und Pro
Pro: Auswertung aller bei TradingView verfügbaren Symbole bis zu 40 Jahre in die Vergangenheit
Lite: Wie Pro, jedoch nur "DAX", "SPX" und "NDX" bis zu 40 Jahre in die Vergangenheit, alle anderen Symbole 5 Jahre.
릴리즈 노트
Bugfixing when using a period over the turn of the year.릴리즈 노트
English- Period for the calculation of the seasonal chart can now be done via the specific inputs of year numbers. Thus, the limitation of 40 years is also removed.
- Display of the symbol name in the table at the right margin.
Deutsch
- Periode für die Berechnung des saisonalen Charts kann nun über die gezielte Eingaben von Jahreszahlen erfolgen. Somit ist auch die Begrenzung von 40 Jahre aufgehoben.
- Anzeige des Symbolnamens in der Tabelle am rechten Rand.
릴리즈 노트
V4English
Fixed a bug when start year was <= year of first historical date.
Deutsch
Fehlerbhebung wenn das Startjahr <= dem Jahr der ersten historischen Daten gewesen ist.
Neu: Anleitungsvideo auf Deutsch: LINK
릴리즈 노트
Englisch- Bug fix for chart calculation when end year is greater than current year.
- Default setting for end year set to 2030.
- Spacing is dynamically adjusted to chart size.
- Additional setting of Close/Open for start and end.
- Position of the overview table can now be set to right or top.
Deutsch
- Fehlerbehebung für die Berechnung des Chart, wenn Endjahr größer dem aktuellem Jahr ist.
- Standardeinstellung für Endjahr auf 2030 gesetzt.
- Abstände werden dynamisch an Chart-Größe angepasst.
- Zusätzliche Einstellung von Close/Open für Start und Ende.
- Position der Übersichttabelle nun einstellbar rechts oder oben.
Buy at Digistore24
릴리즈 노트
English- Display "Yearly average return" added:
- Display "Average return" changed to "Average period return":
- Added Tooltips for "Yearly average return" and "Average return".
- Added setting "Show current date".
- Added setting "Exclude Covid-V".
- Added setting "Show monthly return".
Deutsch
- Anzeige „Yearly average return” hinzugefügt.
- Anzeige „Average return” in „Average period return” geändert.
- Tooltips für „Yearly average return" und „Average return” hinzugefügt.
- Einstellung „Show current date“ hinzugefügt.
- Einstellung „Exclude Covid-V“ hinzugefügt.
- Einstellung „Show monthly return“ hinzugefügt.
릴리즈 노트
V7English
- Setting of text sizes added.
- Display of the results table "top" adjusted.
Deutsch
- Einstellung von Textgrößen hinzugefügt.
- Aufteilung für die Darstellung der Ergebnis-Tabelle "top" angepasst.
릴리즈 노트
V8English
- Selection of chart text color to be able to set a suitable color depending on the background.
- Trade type (long or short) added in the settings and calculation of trades and summary adjusted accordingly.
- Result Table position added to "None" to turn it off.
- Period Table can be switched on and off.
- Bug fixing when displaying monthly returns if their value is larger than the seasonal chart. In this case the monthly returns extended beyond the chart into the month labels.
- Check if the indicator is called in the daily timeframe.
- Result table implemented as table instead of box (parameter).
- format.mintick used for start price, end price and profit.
- Avg. max rise/drop added.
- Display of "Avg. period return" directly in the chart.
Deutsch
- Auswahl der Chart-Text-Farbe, um je nach Hintergrund eine passende Farbe einstellen zu können.
- Trade type (Long oder Short) in den Einstellungen hinzugefügt und Berechnung der Trades und der Zusammenfassung entsprechend angepasst.
- Result Table Position um "None" ergänzt, um diese auszuschalten.
- Period Table ein- und ausschaltbar.
- Bug-Behebung beim Anzeigen der Monthly Returns, wenn deren Wert größer als der saisonale Chart sind. In diesem Fall ragten die Monthly Return über den Chart hinaus in die Monats-Bezeichnungen hinein.
- Überprüfung, ob der Indikator im daily timeframe aufgerufen wird.
- Result Table als Table anstatt als Box umgesetzt (Parameter).
- format.mintick für start price, end price und profit verwendet.
- Avg. max rise/drop hinzugefügt.
- Anzeige von "Avg. period return" direkt im Chart.
Anleitungsvideo auf Deutsch: LINK
Pro-Version: Digistore24
릴리즈 노트
V9English
- Color of chart line adjustable.
- "show_avg_period_return" added.
- Added „left“ to "result_table_pos".
- Added parameter "First month".
- Added quarterly performance analysis.
Deutsch
- Farbe der Chart Linie einstellbar.
- "show_avg_period_return" hinzugefügt.
- "result_table_pos" um "Left " ergänzt.
- Einstellung "First month" hinzugefügt.
- Quarterly performance analysis hinzugefügt.
Anleitungsvideo auf Deutsch: LINK
Pro-Version: Digistore24
초대 전용 스크립트
이 스크립트는 작성자가 승인한 사용자만 접근할 수 있습니다. 사용하려면 요청 후 승인을 받아야 하며, 일반적으로 결제 후에 허가가 부여됩니다. 자세한 내용은 아래 작성자의 안내를 따르거나 funcharts에게 직접 문의하세요.
트레이딩뷰는 스크립트의 작동 방식을 충분히 이해하고 작성자를 완전히 신뢰하지 않는 이상, 해당 스크립트에 비용을 지불하거나 사용하는 것을 권장하지 않습니다. 커뮤니티 스크립트에서 무료 오픈소스 대안을 찾아보실 수도 있습니다.
작성자 지시 사항
For accessing this script please send me a PN or visit https://www.digistore24.com/product/425024
면책사항
해당 정보와 게시물은 금융, 투자, 트레이딩 또는 기타 유형의 조언이나 권장 사항으로 간주되지 않으며, 트레이딩뷰에서 제공하거나 보증하는 것이 아닙니다. 자세한 내용은 이용 약관을 참조하세요.