OPEN-SOURCE SCRIPT
[PlayBit]Correlation-Co _OI

[PlayBit] Correlation-Co _OI
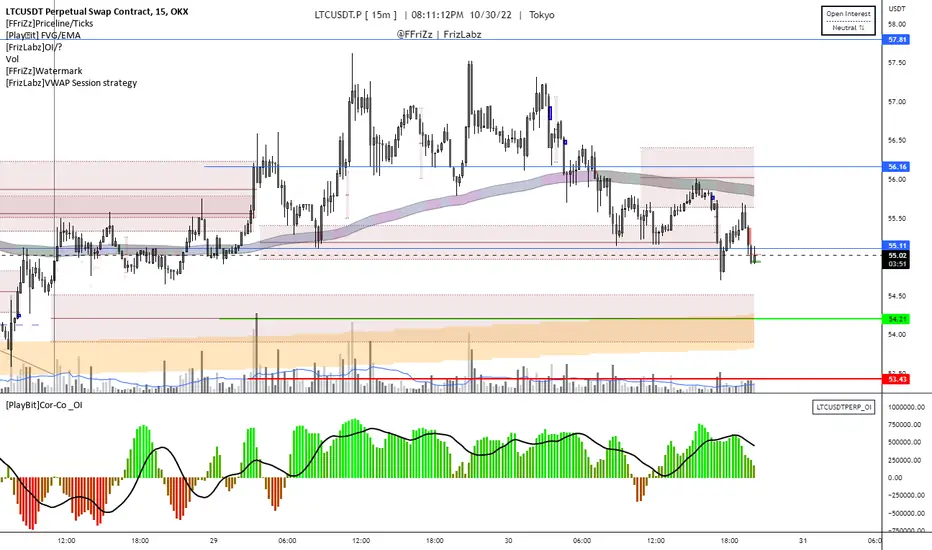
This Indicator uses a Correlation Coefficient to compare a Crypto Currency to the Binance Open Interest feed if the data is provided
A move in the same direction is indicated with a positive value (the indicator will move up)
A move in the opposite direction the indicator will indicate with a negative value (the indicator will move down)
If both are moving in the same direction and are converging or diverging this will be shown by larger values for divergence and smaller for convergence but will be a positive value
Negative values are shown when price and _OI are moving opposite each other
You can toggle the auto Open Interest option in the settings to use something other than Open Interest if you would like
I still need to add a visual showing when longs are unwinding or opening and when shorts are covering or opening
This is a concept that I made for JOHNNY a while back and I'm republishing public from private
This can be useful when comparing a Asset with its Open Interest
The main bit of code was taken from:
https://www.tradingview.com/script/y5n6dlJm-Spearman-Rank-Correlation-Coefficient/
by mortdiggiddy
Let me know if you have any Ideas or suggestions or if I overlooked something
Hope you enjoy,
FFriZz | frizlabz
오픈 소스 스크립트
트레이딩뷰의 진정한 정신에 따라, 이 스크립트의 작성자는 이를 오픈소스로 공개하여 트레이더들이 기능을 검토하고 검증할 수 있도록 했습니다. 작성자에게 찬사를 보냅니다! 이 코드는 무료로 사용할 수 있지만, 코드를 재게시하는 경우 하우스 룰이 적용된다는 점을 기억하세요.
면책사항
해당 정보와 게시물은 금융, 투자, 트레이딩 또는 기타 유형의 조언이나 권장 사항으로 간주되지 않으며, 트레이딩뷰에서 제공하거나 보증하는 것이 아닙니다. 자세한 내용은 이용 약관을 참조하세요.
오픈 소스 스크립트
트레이딩뷰의 진정한 정신에 따라, 이 스크립트의 작성자는 이를 오픈소스로 공개하여 트레이더들이 기능을 검토하고 검증할 수 있도록 했습니다. 작성자에게 찬사를 보냅니다! 이 코드는 무료로 사용할 수 있지만, 코드를 재게시하는 경우 하우스 룰이 적용된다는 점을 기억하세요.
면책사항
해당 정보와 게시물은 금융, 투자, 트레이딩 또는 기타 유형의 조언이나 권장 사항으로 간주되지 않으며, 트레이딩뷰에서 제공하거나 보증하는 것이 아닙니다. 자세한 내용은 이용 약관을 참조하세요.