OPEN-SOURCE SCRIPT
FVG within Specific NY Time
Disclaimer: This indicator is designed solely for educational and informational purposes. The creator assumes no liability for any financial losses incurred as a result of utilizing this indicator or strategy. Users are advised to exercise discretion and consult with a professional advisor before engaging in trading based on this tool.
Strategy Overview
This strategy focuses on pinpointing unfilled Fixed Value Gaps (FVGs) within a five-minute timeframe during predetermined intervals throughout the day, which we term "Liquidity Injection Intervals." The concept of this strategy is that unfilled FVGs in these intervals will likely be tested before continuation of the trend.
To implement this strategy:
Liquidity Injection Intervals (EST/NY Time):
How to use this Indicator
Add this indicator to your chart
Set the chart timeframe to 5m
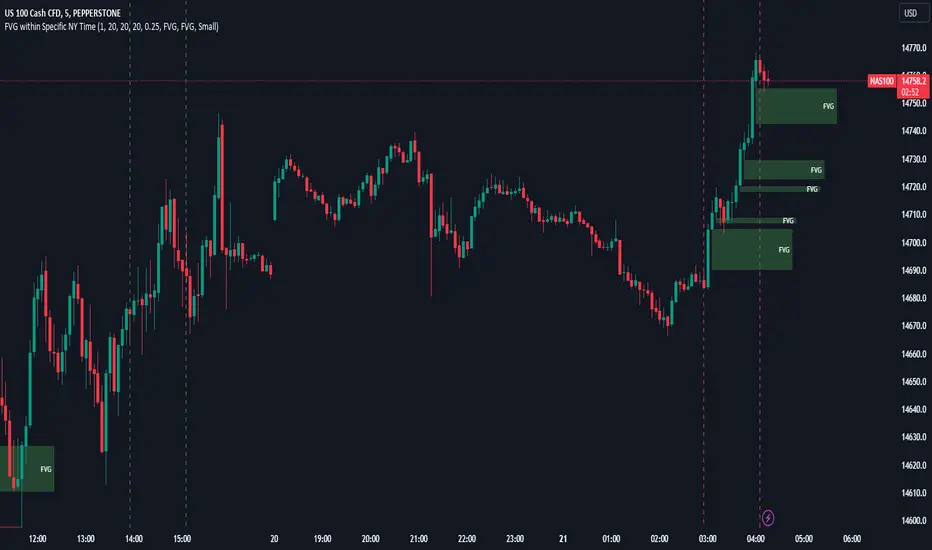
This indicator will highlight the predefined intervals using dotted vertical lines and draw identify the FVG. Do note that this indicator does not display FVGs that have been filled. You are to manually identify the stop loss and take profit.
Feel free to use this code and adapt it to your own trading strategies. Happy trading!
Strategy Overview
This strategy focuses on pinpointing unfilled Fixed Value Gaps (FVGs) within a five-minute timeframe during predetermined intervals throughout the day, which we term "Liquidity Injection Intervals." The concept of this strategy is that unfilled FVGs in these intervals will likely be tested before continuation of the trend.
To implement this strategy:
- Identify an FVG, ideally closer to the end of the specified time interval.
Place entry orders anticipating the gap to be filled. - Set stop-loss orders at the extremity of the wick from which the FVG originated. If the FVG arises amidst a sustained directional movement, the stop should be placed at the wick of the initiating candle of that movement.
- While there is no predefined target profit (TP) for this strategy, I would advice to aim for at least a 2:1 Reward to Risk. Ensure that your TP lies within a plausible reach, considering the price action of that day.
Liquidity Injection Intervals (EST/NY Time):
- 3 AM - 4 AM
- 10 AM - 11 AM
- 2 PM - 3 PM
How to use this Indicator
Add this indicator to your chart
Set the chart timeframe to 5m
This indicator will highlight the predefined intervals using dotted vertical lines and draw identify the FVG. Do note that this indicator does not display FVGs that have been filled. You are to manually identify the stop loss and take profit.
Feel free to use this code and adapt it to your own trading strategies. Happy trading!
오픈 소스 스크립트
트레이딩뷰의 진정한 정신에 따라, 이 스크립트의 작성자는 이를 오픈소스로 공개하여 트레이더들이 기능을 검토하고 검증할 수 있도록 했습니다. 작성자에게 찬사를 보냅니다! 이 코드는 무료로 사용할 수 있지만, 코드를 재게시하는 경우 하우스 룰이 적용된다는 점을 기억하세요.
면책사항
해당 정보와 게시물은 금융, 투자, 트레이딩 또는 기타 유형의 조언이나 권장 사항으로 간주되지 않으며, 트레이딩뷰에서 제공하거나 보증하는 것이 아닙니다. 자세한 내용은 이용 약관을 참조하세요.
오픈 소스 스크립트
트레이딩뷰의 진정한 정신에 따라, 이 스크립트의 작성자는 이를 오픈소스로 공개하여 트레이더들이 기능을 검토하고 검증할 수 있도록 했습니다. 작성자에게 찬사를 보냅니다! 이 코드는 무료로 사용할 수 있지만, 코드를 재게시하는 경우 하우스 룰이 적용된다는 점을 기억하세요.
면책사항
해당 정보와 게시물은 금융, 투자, 트레이딩 또는 기타 유형의 조언이나 권장 사항으로 간주되지 않으며, 트레이딩뷰에서 제공하거나 보증하는 것이 아닙니다. 자세한 내용은 이용 약관을 참조하세요.