OPEN-SOURCE SCRIPT
Multi-Timeframe 325 SMA Touch
Multi-Timeframe 325 SMA Touch Indicator
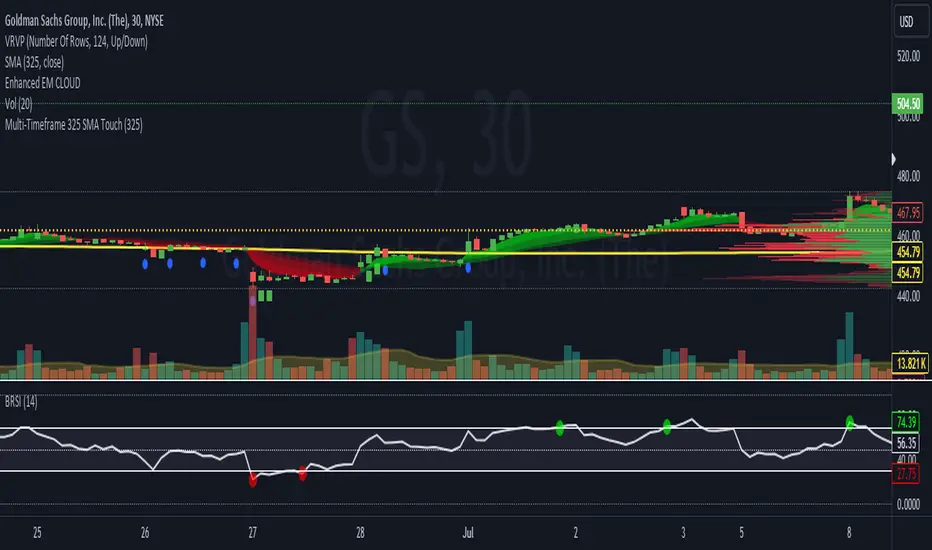
This versatile indicator detects and visualizes when the price touches (crosses over or under) the 325-period Simple Moving Average (SMA) across multiple timeframes. It's designed to help traders identify potential support and resistance levels across various time horizons.
Key Features:
Monitors 7 different timeframes: 30 minutes, 1 hour, 2 hours, 4 hours, 6 hours, 12 hours, and 1 day.
Customizable: Each timeframe can be toggled on or off individually.
Visual cues: Unique shapes and colors for each timeframe make it easy to distinguish touches on different time scales.
Adjustable SMA length: While defaulted to 325 periods, the SMA length can be modified to suit your strategy.
Current timeframe SMA: Displays the 325 SMA on the chart for additional context.
How it Works:
The indicator checks for price touches on the 325 SMA for each selected timeframe. When a touch occurs, it plots a distinct shape below the price bar:
30 minutes: Blue circle
1 hour: Green square
2 hours: Red triangle (up)
4 hours: Purple diamond
6 hours: Teal triangle (down)
12 hours: Orange X
1 day: White circle
The 325 SMA for the current chart timeframe is also plotted as a yellow line for reference.
Use Cases:
Identify potential support and resistance levels across multiple timeframes
Spot confluences where touches occur on multiple timeframes simultaneously
Enhance your multi-timeframe analysis for more informed trading decisions
Use as a filter or confirmation tool in your existing trading strategy
Customization:
You can easily customize the indicator by adjusting the SMA length or toggling specific timeframes on/off to focus on the time horizons most relevant to your trading style.
오픈 소스 스크립트
트레이딩뷰의 진정한 정신에 따라, 이 스크립트의 작성자는 이를 오픈소스로 공개하여 트레이더들이 기능을 검토하고 검증할 수 있도록 했습니다. 작성자에게 찬사를 보냅니다! 이 코드는 무료로 사용할 수 있지만, 코드를 재게시하는 경우 하우스 룰이 적용된다는 점을 기억하세요.
면책사항
해당 정보와 게시물은 금융, 투자, 트레이딩 또는 기타 유형의 조언이나 권장 사항으로 간주되지 않으며, 트레이딩뷰에서 제공하거나 보증하는 것이 아닙니다. 자세한 내용은 이용 약관을 참조하세요.
오픈 소스 스크립트
트레이딩뷰의 진정한 정신에 따라, 이 스크립트의 작성자는 이를 오픈소스로 공개하여 트레이더들이 기능을 검토하고 검증할 수 있도록 했습니다. 작성자에게 찬사를 보냅니다! 이 코드는 무료로 사용할 수 있지만, 코드를 재게시하는 경우 하우스 룰이 적용된다는 점을 기억하세요.
면책사항
해당 정보와 게시물은 금융, 투자, 트레이딩 또는 기타 유형의 조언이나 권장 사항으로 간주되지 않으며, 트레이딩뷰에서 제공하거나 보증하는 것이 아닙니다. 자세한 내용은 이용 약관을 참조하세요.