PROTECTED SOURCE SCRIPT
Pump and Dump Probability
The "Pump and Dump Probability" indicator is designed to provide traders with a probability score to detect potential pump and dump schemes in the market. It doesn't guarantee that a pump and dump will happen but offers a quantified metric to analyze suspicious trading activity. It evaluates four critical conditions, each contributing up to 25 points to the overall probability score. The conditions are:
Volume Surge: This assesses the current volume against a short-term moving average of the volume. A surge in volume can sometimes indicate the "pump" phase where the price is artificially inflated.
Price Acceleration: By comparing short-term price changes to longer-term changes, the script identifies unnatural accelerations in price that might not be backed by genuine market sentiment.
Moving Average Deviation: In regular market conditions, prices tend to hover around their moving averages. Large deviations, especially in the absence of significant news or events, can be suspicious.
RSI Overbought Condition: Extremely high RSI values can suggest overbought conditions. When combined with other signs, it can contribute to the suspicion of a pump and dump.
Usage:
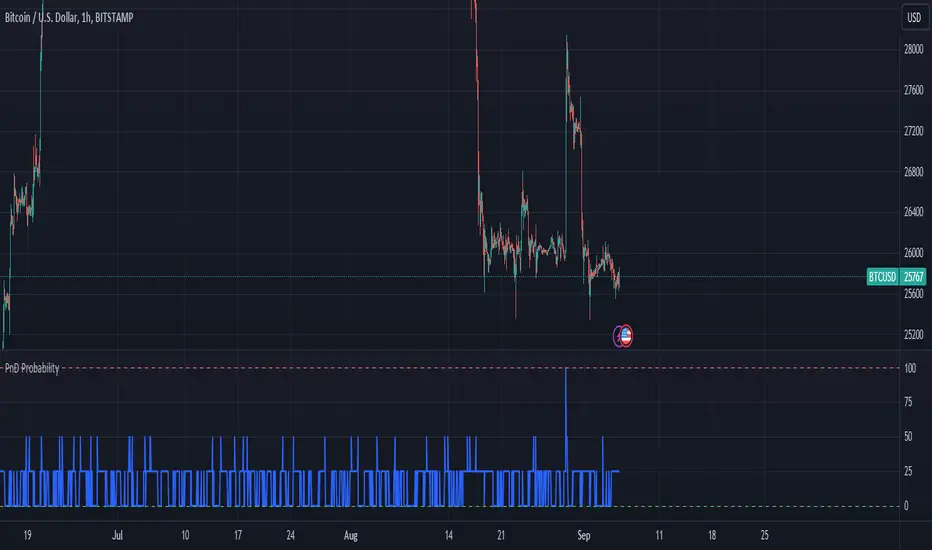
Probability Score: The primary output of this script is a score ranging from 0 to 100. A score closer to 100 indicates a higher probability of pump and dump activity.
Threshold Levels: A max probability level at 100 (red) and a min probability level at 0 (green) are plotted for reference.
Parameters:
The script allows users to customize:
RSI Period: To adjust the sensitivity of the RSI calculation.
Extreme RSI Overbought Level: The RSI threshold for considering a market overbought.
Volume Multiplier: Define what constitutes a volume "surge" by setting this multiplier.
Short & Long Term Periods: These are for calculating price acceleration and setting the duration of the moving averages.
Charting:
The script outputs a clean and straightforward graph showing the probability score. The score itself is plotted in blue, with two horizontal reference lines at 0 (green) and 100 (red) to quickly assess the relative position of the current probability score.
Note:
While individual components (like RSI or volume analysis) are well-established in trading, our script's originality lies in its composite approach. Each indicator by itself might not be decisive, but when they converge, the likelihood of a pump and dump scenario increases. This integrated methodology offers a nuanced perspective that's more than the sum of its parts.
It's essential to remember that this script doesn't guarantee a pump and dump situation but merely quantifies specific market conditions that might indicate one. Always conduct thorough research and due diligence when using this or any other trading tool.
Volume Surge: This assesses the current volume against a short-term moving average of the volume. A surge in volume can sometimes indicate the "pump" phase where the price is artificially inflated.
Price Acceleration: By comparing short-term price changes to longer-term changes, the script identifies unnatural accelerations in price that might not be backed by genuine market sentiment.
Moving Average Deviation: In regular market conditions, prices tend to hover around their moving averages. Large deviations, especially in the absence of significant news or events, can be suspicious.
RSI Overbought Condition: Extremely high RSI values can suggest overbought conditions. When combined with other signs, it can contribute to the suspicion of a pump and dump.
Usage:
Probability Score: The primary output of this script is a score ranging from 0 to 100. A score closer to 100 indicates a higher probability of pump and dump activity.
Threshold Levels: A max probability level at 100 (red) and a min probability level at 0 (green) are plotted for reference.
Parameters:
The script allows users to customize:
RSI Period: To adjust the sensitivity of the RSI calculation.
Extreme RSI Overbought Level: The RSI threshold for considering a market overbought.
Volume Multiplier: Define what constitutes a volume "surge" by setting this multiplier.
Short & Long Term Periods: These are for calculating price acceleration and setting the duration of the moving averages.
Charting:
The script outputs a clean and straightforward graph showing the probability score. The score itself is plotted in blue, with two horizontal reference lines at 0 (green) and 100 (red) to quickly assess the relative position of the current probability score.
Note:
While individual components (like RSI or volume analysis) are well-established in trading, our script's originality lies in its composite approach. Each indicator by itself might not be decisive, but when they converge, the likelihood of a pump and dump scenario increases. This integrated methodology offers a nuanced perspective that's more than the sum of its parts.
It's essential to remember that this script doesn't guarantee a pump and dump situation but merely quantifies specific market conditions that might indicate one. Always conduct thorough research and due diligence when using this or any other trading tool.
보호된 스크립트입니다
이 스크립트는 비공개 소스로 게시됩니다. 하지만 이를 자유롭게 제한 없이 사용할 수 있습니다 – 자세한 내용은 여기에서 확인하세요.
면책사항
해당 정보와 게시물은 금융, 투자, 트레이딩 또는 기타 유형의 조언이나 권장 사항으로 간주되지 않으며, 트레이딩뷰에서 제공하거나 보증하는 것이 아닙니다. 자세한 내용은 이용 약관을 참조하세요.
면책사항
해당 정보와 게시물은 금융, 투자, 트레이딩 또는 기타 유형의 조언이나 권장 사항으로 간주되지 않으며, 트레이딩뷰에서 제공하거나 보증하는 것이 아닙니다. 자세한 내용은 이용 약관을 참조하세요.