PROTECTED SOURCE SCRIPT
업데이트됨 Market Breadth - Primary Indicator
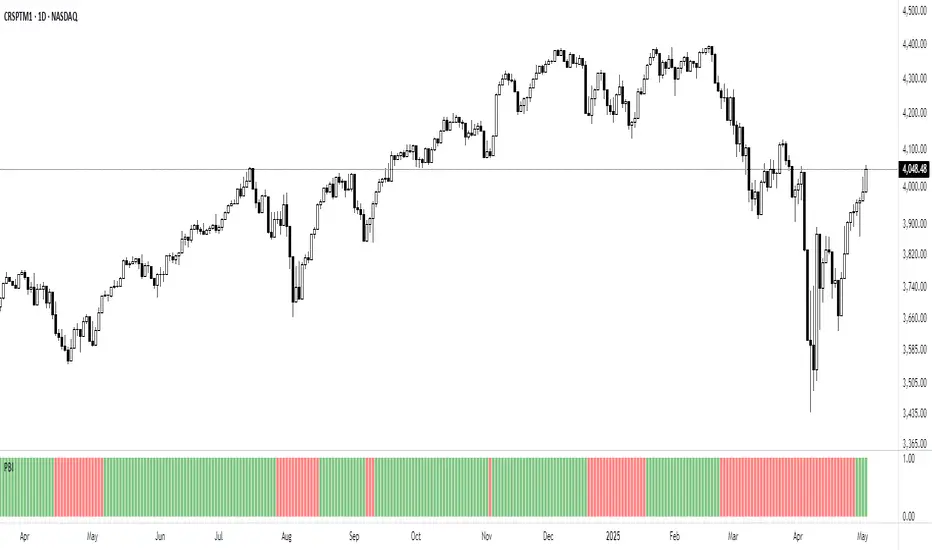
Market Breath is the equilibrium between number of stocks in advance to those in a decline, in other words a method to determine the current market environment. In a positive phase bullish setups will have improved probabilities and presence, whereas in a bearish phase the opposite would be true.
The primary indicator measure the trend in SPY and correlation between different EMA's.
- Green Columns: Positive Breadth
- Red Columns: Negative Breadth
This indicator can be combined with the secondary breadth indicator to further note excessive movement and risk of mean reversion.
The primary indicator measure the trend in SPY and correlation between different EMA's.
- Green Columns: Positive Breadth
- Red Columns: Negative Breadth
This indicator can be combined with the secondary breadth indicator to further note excessive movement and risk of mean reversion.
릴리즈 노트
You can now customize which symbol / market the indicator will be based on.릴리즈 노트
This version is now based on NASDAQ:CRSPTM1, which tracks the US Total Market Index. This expands coverage to a broader spectrum of U.S. equities.릴리즈 노트
Updated chart and color scheme.보호된 스크립트입니다
이 스크립트는 비공개 소스로 게시됩니다. 하지만 이를 자유롭게 제한 없이 사용할 수 있습니다 – 자세한 내용은 여기에서 확인하세요.
Technical Trading: Research and Application
stockleave.com/
stockleave.com/
면책사항
해당 정보와 게시물은 금융, 투자, 트레이딩 또는 기타 유형의 조언이나 권장 사항으로 간주되지 않으며, 트레이딩뷰에서 제공하거나 보증하는 것이 아닙니다. 자세한 내용은 이용 약관을 참조하세요.
보호된 스크립트입니다
이 스크립트는 비공개 소스로 게시됩니다. 하지만 이를 자유롭게 제한 없이 사용할 수 있습니다 – 자세한 내용은 여기에서 확인하세요.
Technical Trading: Research and Application
stockleave.com/
stockleave.com/
면책사항
해당 정보와 게시물은 금융, 투자, 트레이딩 또는 기타 유형의 조언이나 권장 사항으로 간주되지 않으며, 트레이딩뷰에서 제공하거나 보증하는 것이 아닙니다. 자세한 내용은 이용 약관을 참조하세요.