INVITE-ONLY SCRIPT
업데이트됨 Relative Breadth Index
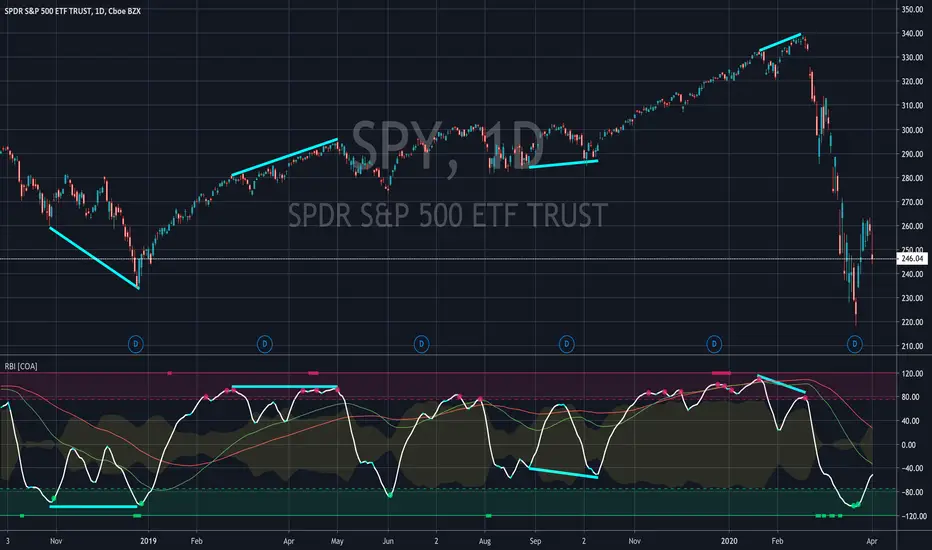
RBI is an intricate oscillator that calculates relative breadth of an asset according to its trend. If you want to detect reversals, continuations, trend strength, divergences, and confirm other signals, read on.
Relative Breadth Index has 4 main components:
How does it work?
What are the signals?
What about the Pulse?
For access, please DM us or visit the link below in our Signature.
Relative Breadth Index has 4 main components:
- Fast (White), Medium (Green), and Slow (Red) Oscillators
- Overbought and Oversold Thresholds (Shaded Areas)
- Pulse (Yellow)
- Divergence Indicator (Rectangles)
How does it work?
- The Medium and Slow Oscillators indicate the general trend.
- The Fast Oscillator shows what price action is doing in reference to that trend.
- Pulse suggests the probability that the current move (Fast) is an end of the trend defined by the Medium and Slow lines.
- The Divergence Indicator also suggests a reversal and to look for divergences between the Fast line and price action.
What are the signals?
- In general: green signals are bullish, red are bullish
- Rectangles: Look for a divergence
- Circles: Sell and buy signals
- Triangles: Stronger sell and buy signals
- Triangles: Reversal signal
What about the Pulse?
- If Pulse is low, a signal may only be a short-lived move.
- If Pulse is high, a signal may be a full-on trend reversal.
For access, please DM us or visit the link below in our Signature.
릴리즈 노트
You can now set alerts off RBI signals.초대 전용 스크립트
이 스크립트는 작성자가 승인한 사용자만 접근할 수 있습니다. 사용하려면 요청 후 승인을 받아야 하며, 일반적으로 결제 후에 허가가 부여됩니다. 자세한 내용은 아래 작성자의 안내를 따르거나 CoinObservatory에게 직접 문의하세요.
트레이딩뷰는 스크립트의 작동 방식을 충분히 이해하고 작성자를 완전히 신뢰하지 않는 이상, 해당 스크립트에 비용을 지불하거나 사용하는 것을 권장하지 않습니다. 커뮤니티 스크립트에서 무료 오픈소스 대안을 찾아보실 수도 있습니다.
작성자 지시 사항
Thanks for checking us out!
For access to our TradingView scripts, visit us at
linktr.ee/coinobs
For access to our TradingView scripts, visit us at
linktr.ee/coinobs
면책사항
해당 정보와 게시물은 금융, 투자, 트레이딩 또는 기타 유형의 조언이나 권장 사항으로 간주되지 않으며, 트레이딩뷰에서 제공하거나 보증하는 것이 아닙니다. 자세한 내용은 이용 약관을 참조하세요.
초대 전용 스크립트
이 스크립트는 작성자가 승인한 사용자만 접근할 수 있습니다. 사용하려면 요청 후 승인을 받아야 하며, 일반적으로 결제 후에 허가가 부여됩니다. 자세한 내용은 아래 작성자의 안내를 따르거나 CoinObservatory에게 직접 문의하세요.
트레이딩뷰는 스크립트의 작동 방식을 충분히 이해하고 작성자를 완전히 신뢰하지 않는 이상, 해당 스크립트에 비용을 지불하거나 사용하는 것을 권장하지 않습니다. 커뮤니티 스크립트에서 무료 오픈소스 대안을 찾아보실 수도 있습니다.
작성자 지시 사항
Thanks for checking us out!
For access to our TradingView scripts, visit us at
linktr.ee/coinobs
For access to our TradingView scripts, visit us at
linktr.ee/coinobs
면책사항
해당 정보와 게시물은 금융, 투자, 트레이딩 또는 기타 유형의 조언이나 권장 사항으로 간주되지 않으며, 트레이딩뷰에서 제공하거나 보증하는 것이 아닙니다. 자세한 내용은 이용 약관을 참조하세요.