PROTECTED SOURCE SCRIPT
업데이트됨 Shaktiman [DSS_Rajput]
I'm a Momentum Trader, following the Indian markets, Mark Minervini and William O'Neil follower.
User Settings
Inputs tab
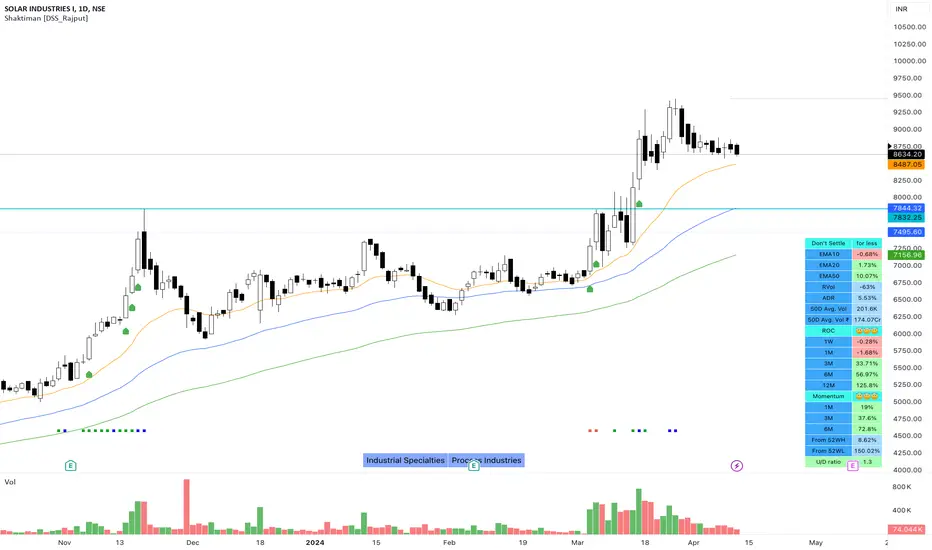
EMA option for Table - It compares the current price of the symbol to its key EMA's and calculates the rate of return to make it easier to track the performance of the symbol. It Helps you to identify how far the price is from its Key EMA's
ADDITIONAL TABLE DATA - It will allow you to use multiple performance data sets with your set of customizable inputs (You can change periods as per your requirements)
Show Inside Bar (IB): Allows you to add Inside Bar on your chart
Show NR4 (Narrow Range): Allows you to add an NR4 bar on your chart
Show INR7(Narrow Range): Allows you to add NR7 Bar on your chart
Distance_From_EMA_Table: Allows you to enable/disable the price difference with its key EMA's table.
ROC_Table: It compares the current price of the symbol to its past price and calculates the rate of return to make it easier to track the performance of the symbol.
Note that the Performance sidebar is not updated in real-time, while this indicator is, so on real-time charts.
The formula of the calculation is (Current value - Past value) * 100 / Past value, where Past value is: 1W, 1M, 3M, 6M, 1Y
Momentum_Table: It compares the current price of the symbol to its past lowest price of that period and calculates the %Gain of the symbol from the low of that period
Power_Play_Candidate: It will show the power play candidate, similar to IBD, It merely qualifies for Power_Play.
You need to wait for the Right Entry point. It will give you 8 Week Range.
According to IBD, it should move 100%+ in less than 8 weeks. You can modify your criteria by changing the percentage gain.
U/D Ratio: IBD defines the U/D ratio as "A 50-day ratio that is derived by dividing total volume on up days by the total volume on down days.
A ratio greater than 1.0 implies positive demand for a stock"
UpVol criteria: close>open and vice versa for DownVol
Rvol (Relative Vol): Percentage volume change (compared to daily average volume)
ADR: It allows you to add the Average Daily Range to the table.
Show 50D Avg. Vol & Avg. Vol rupee: It allows you to add 50-Day Avg. Vol and 50-Day Avg. Vol rupee.
Show_Bull_Snort: Allows you to add bull snort to your chart and style the bar.
Bull Snort is the work of Oliver Kell. For more info about Oliver kell, check youtube videos of Oliver Kell.
Normal Moving Average: Plot 4 Simple, Exponential, and Weighted Moving Averages. (You can choose an option between EMA/SMA/WMA)
Fixed Moving Average [Daily TF]: Plot 4 Simple, Exponential, and Weighted Moving Averages. (You can choose an option between EMA/SMA/WMA)
Plus Point: It will not change its value when you switch to a different timeframe. Let's say you applied Fixed Daily 20MA, on the intraday chart.
It will not change its value and It will give you much more clarity that, from where the price is bouncing from 20MA. Explore it (You will definitely love it!)
Fixed Moving Average [Weekly Timeframe]: Plot 2 Simple, Exponential, and Weighted Moving Averages. (You can choose an option between EMA/SMA/WMA) [Weekly MA on Daily & intraday charts]
Plus Point: It will not change its value when you switch to a different timeframe. (It's like Plotting 10 Week Line on Daily Chart & Intraday Charts)
Numbers of weeks to show High & Low: It will add data to the tables and also add 52 weeks of High & Low lines on the charts.
(Number of weeks is customizable, you can change as per your requirements.)
Style tab
You can modify the style and color of any of the inputs except table color.
Conclusion
If you like this script, click on Add to favorite indicators, so that you can easily add this indicator from your favorites tab right away.
Hope you find this useful. Please leave any questions you have in the comment section and I'll be happy to answer them.
Thanks!
User Settings
Inputs tab
EMA option for Table - It compares the current price of the symbol to its key EMA's and calculates the rate of return to make it easier to track the performance of the symbol. It Helps you to identify how far the price is from its Key EMA's
ADDITIONAL TABLE DATA - It will allow you to use multiple performance data sets with your set of customizable inputs (You can change periods as per your requirements)
Show Inside Bar (IB): Allows you to add Inside Bar on your chart
Show NR4 (Narrow Range): Allows you to add an NR4 bar on your chart
Show INR7(Narrow Range): Allows you to add NR7 Bar on your chart
Distance_From_EMA_Table: Allows you to enable/disable the price difference with its key EMA's table.
ROC_Table: It compares the current price of the symbol to its past price and calculates the rate of return to make it easier to track the performance of the symbol.
Note that the Performance sidebar is not updated in real-time, while this indicator is, so on real-time charts.
The formula of the calculation is (Current value - Past value) * 100 / Past value, where Past value is: 1W, 1M, 3M, 6M, 1Y
Momentum_Table: It compares the current price of the symbol to its past lowest price of that period and calculates the %Gain of the symbol from the low of that period
Power_Play_Candidate: It will show the power play candidate, similar to IBD, It merely qualifies for Power_Play.
You need to wait for the Right Entry point. It will give you 8 Week Range.
According to IBD, it should move 100%+ in less than 8 weeks. You can modify your criteria by changing the percentage gain.
U/D Ratio: IBD defines the U/D ratio as "A 50-day ratio that is derived by dividing total volume on up days by the total volume on down days.
A ratio greater than 1.0 implies positive demand for a stock"
UpVol criteria: close>open and vice versa for DownVol
Rvol (Relative Vol): Percentage volume change (compared to daily average volume)
ADR: It allows you to add the Average Daily Range to the table.
Show 50D Avg. Vol & Avg. Vol rupee: It allows you to add 50-Day Avg. Vol and 50-Day Avg. Vol rupee.
Show_Bull_Snort: Allows you to add bull snort to your chart and style the bar.
Bull Snort is the work of Oliver Kell. For more info about Oliver kell, check youtube videos of Oliver Kell.
Normal Moving Average: Plot 4 Simple, Exponential, and Weighted Moving Averages. (You can choose an option between EMA/SMA/WMA)
Fixed Moving Average [Daily TF]: Plot 4 Simple, Exponential, and Weighted Moving Averages. (You can choose an option between EMA/SMA/WMA)
Plus Point: It will not change its value when you switch to a different timeframe. Let's say you applied Fixed Daily 20MA, on the intraday chart.
It will not change its value and It will give you much more clarity that, from where the price is bouncing from 20MA. Explore it (You will definitely love it!)
Fixed Moving Average [Weekly Timeframe]: Plot 2 Simple, Exponential, and Weighted Moving Averages. (You can choose an option between EMA/SMA/WMA) [Weekly MA on Daily & intraday charts]
Plus Point: It will not change its value when you switch to a different timeframe. (It's like Plotting 10 Week Line on Daily Chart & Intraday Charts)
Numbers of weeks to show High & Low: It will add data to the tables and also add 52 weeks of High & Low lines on the charts.
(Number of weeks is customizable, you can change as per your requirements.)
Style tab
You can modify the style and color of any of the inputs except table color.
Conclusion
If you like this script, click on Add to favorite indicators, so that you can easily add this indicator from your favorites tab right away.
Hope you find this useful. Please leave any questions you have in the comment section and I'll be happy to answer them.
Thanks!
릴리즈 노트
- New Running 52Week High and Low are added. You can change the period as per your requirements. The default is 252 days which is equal to 52 weeks.
- It will be helpful in checking the period from which the stock is making new highs and vice versa for lows.
릴리즈 노트
- Added Color Option for tables
- Added New 3Month High Signal, 6month High, 12Month(52week High)
릴리즈 노트
- Updated UDVolume Ratio calculation
릴리즈 노트
- Added Sector and Industry table
릴리즈 노트
- Update 52Week high calculation formula for showing correct results while backtesting
보호된 스크립트입니다
이 스크립트는 비공개 소스로 게시됩니다. 하지만 이를 자유롭게 제한 없이 사용할 수 있습니다 – 자세한 내용은 여기에서 확인하세요.
면책사항
해당 정보와 게시물은 금융, 투자, 트레이딩 또는 기타 유형의 조언이나 권장 사항으로 간주되지 않으며, 트레이딩뷰에서 제공하거나 보증하는 것이 아닙니다. 자세한 내용은 이용 약관을 참조하세요.
보호된 스크립트입니다
이 스크립트는 비공개 소스로 게시됩니다. 하지만 이를 자유롭게 제한 없이 사용할 수 있습니다 – 자세한 내용은 여기에서 확인하세요.
면책사항
해당 정보와 게시물은 금융, 투자, 트레이딩 또는 기타 유형의 조언이나 권장 사항으로 간주되지 않으며, 트레이딩뷰에서 제공하거나 보증하는 것이 아닙니다. 자세한 내용은 이용 약관을 참조하세요.