PROTECTED SOURCE SCRIPT
업데이트됨 TRADE ORBIT:INVESTMENT INDICATOR
Key Features:
Relative Strength vs NIFTY
Monthly RS(12): Measures how the symbol is performing relative to NIFTY over the past 12 months.
Positive RS indicates the symbol is outperforming the benchmark.
Momentum Filter (Weekly RSI)
Weekly RSI(12) identifies bullish or bearish momentum.
Background turns green when RSI > 50 and monthly RS > 0, signaling a strong bullish environment.
Background turns red when RSI < 50, monthly RS < 0, and weekly RS(21) < 0, signaling weakness.
Weekly RS(21) Buy/Exit Signals
Buy Signal: Triggered when weekly RS(21) crosses above 0 while background is green, confirming momentum breakout.
Exit Signal: Triggered when weekly RS(21) crosses below 0 while background is green, signaling a reversal in momentum.
Trend & Volatility Tools
SMA 30: Displays the short-term trend for price alignment.
Bollinger Bands (20,2): Measures volatility and potential support/resistance zones.
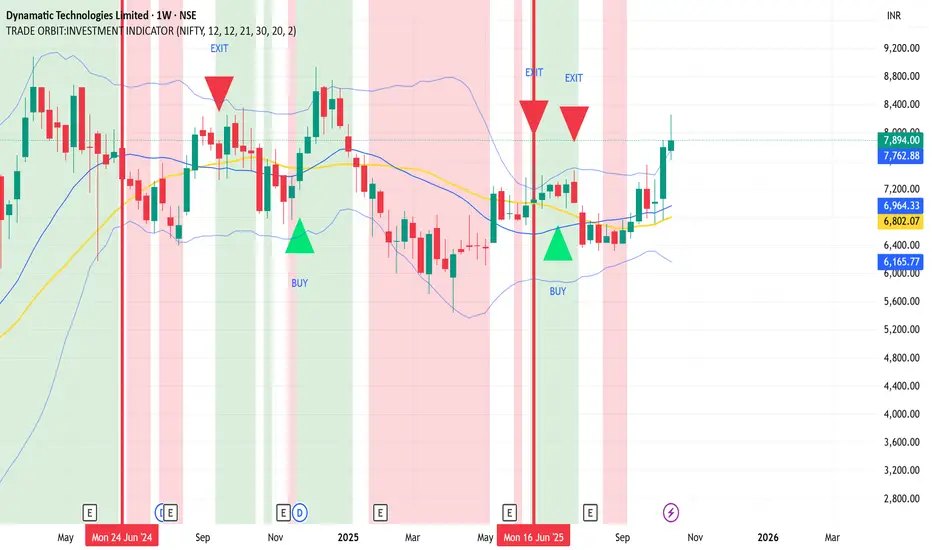
Visuals:
Green/Red semi-transparent backgrounds for bullish/bearish zones.
Buy signals marked with green upward triangles; Exit signals marked with red downward triangles.
SMA30 plotted in yellow; Bollinger Bands plotted in blue.
How to Use:
Entry: Look for green background + weekly RS(21) crossing above zero.
Exit: Close positions when weekly RS(21) crosses below zero.
Use SMA30 and Bollinger Bands to confirm trend and volatility alignment.
This indicator is perfect for traders who want a multi-timeframe strategy combining momentum, relative strength, and trend/volatility confirmation in a single chart overlay
Relative Strength vs NIFTY
Monthly RS(12): Measures how the symbol is performing relative to NIFTY over the past 12 months.
Positive RS indicates the symbol is outperforming the benchmark.
Momentum Filter (Weekly RSI)
Weekly RSI(12) identifies bullish or bearish momentum.
Background turns green when RSI > 50 and monthly RS > 0, signaling a strong bullish environment.
Background turns red when RSI < 50, monthly RS < 0, and weekly RS(21) < 0, signaling weakness.
Weekly RS(21) Buy/Exit Signals
Buy Signal: Triggered when weekly RS(21) crosses above 0 while background is green, confirming momentum breakout.
Exit Signal: Triggered when weekly RS(21) crosses below 0 while background is green, signaling a reversal in momentum.
Trend & Volatility Tools
SMA 30: Displays the short-term trend for price alignment.
Bollinger Bands (20,2): Measures volatility and potential support/resistance zones.
Visuals:
Green/Red semi-transparent backgrounds for bullish/bearish zones.
Buy signals marked with green upward triangles; Exit signals marked with red downward triangles.
SMA30 plotted in yellow; Bollinger Bands plotted in blue.
How to Use:
Entry: Look for green background + weekly RS(21) crossing above zero.
Exit: Close positions when weekly RS(21) crosses below zero.
Use SMA30 and Bollinger Bands to confirm trend and volatility alignment.
This indicator is perfect for traders who want a multi-timeframe strategy combining momentum, relative strength, and trend/volatility confirmation in a single chart overlay
릴리즈 노트
Key Features:Relative Strength vs NIFTY
Monthly RS(12): Measures how the symbol is performing relative to NIFTY over the past 12 months.
Positive RS indicates the symbol is outperforming the benchmark.
Momentum Filter (Weekly RSI)
Weekly RSI(12) identifies bullish or bearish momentum.
Background turns green when RSI > 50 and monthly RS > 0, signaling a strong bullish environment.
Background turns red when RSI < 50, monthly RS < 0, and weekly RS(21) < 0, signaling weakness.
Weekly RS(21) Buy/Exit Signals
Buy Signal: Triggered when weekly RS(21) crosses above 0 while background is green, confirming momentum breakout.
Exit Signal: Triggered when weekly RS(21) crosses below 0 while background is green, signaling a reversal in momentum.
Trend & Volatility Tools
SMA 30: Displays the short-term trend for price alignment.
Bollinger Bands (20,2): Measures volatility and potential support/resistance zones.
Visuals:
Green/Red semi-transparent backgrounds for bullish/bearish zones.
Buy signals marked with green upward triangles; Exit signals marked with red downward triangles.
SMA30 plotted in yellow; Bollinger Bands plotted in blue.
How to Use:
Entry: Look for green background + weekly RS(21) crossing above zero.
Exit: Close positions when weekly RS(21) crosses below zero.
Use SMA30 and Bollinger Bands to confirm trend and volatility alignment.
This indicator is perfect for traders who want a multi-timeframe strategy combining momentum, relative strength, and trend/volatility confirmation in a single chart overlay
보호된 스크립트입니다
이 스크립트는 비공개 소스로 게시됩니다. 하지만 제한 없이 자유롭게 사용할 수 있습니다 — 여기에서 자세히 알아보기.
면책사항
이 정보와 게시물은 TradingView에서 제공하거나 보증하는 금융, 투자, 거래 또는 기타 유형의 조언이나 권고 사항을 의미하거나 구성하지 않습니다. 자세한 내용은 이용 약관을 참고하세요.
보호된 스크립트입니다
이 스크립트는 비공개 소스로 게시됩니다. 하지만 제한 없이 자유롭게 사용할 수 있습니다 — 여기에서 자세히 알아보기.
면책사항
이 정보와 게시물은 TradingView에서 제공하거나 보증하는 금융, 투자, 거래 또는 기타 유형의 조언이나 권고 사항을 의미하거나 구성하지 않습니다. 자세한 내용은 이용 약관을 참고하세요.