OPEN-SOURCE SCRIPT
업데이트됨 Ultimate Volatility Indicator [CC]
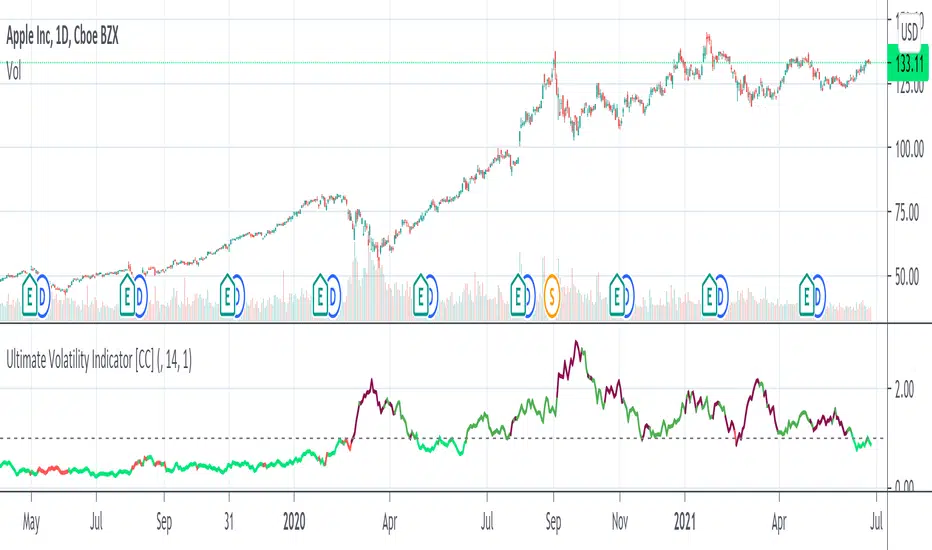
The Ultimate Volatility Indicator was created by Richard Poster (Stocks and Commodities July 2021 pg 21) and this is a very simple but effective indicator. The idea behind volatility indicators is that when the indicator rises above a certain threshold then volatility is high enough and you can make a good amount of money riding the trend in the current direction and then exit when volatility drops below the threshold or until the underlying trend changes.
I have included a threshold that you can change from the default but I would recommend trying out different values to see what works best for you. This indicator will let you know as soon as volatility increases and reacts very quickly. I have included strong buy and sell signals in addition to normal ones so darker colors are strong buy and sell signals and lighter colors are normal signals. Buy when the line turns green and sell when it turns red.
Please let me know if you would like to see me publish any other indicators!
릴리즈 노트
Updated to v5오픈 소스 스크립트
트레이딩뷰의 진정한 정신에 따라, 이 스크립트의 작성자는 이를 오픈소스로 공개하여 트레이더들이 기능을 검토하고 검증할 수 있도록 했습니다. 작성자에게 찬사를 보냅니다! 이 코드는 무료로 사용할 수 있지만, 코드를 재게시하는 경우 하우스 룰이 적용된다는 점을 기억하세요.
면책사항
해당 정보와 게시물은 금융, 투자, 트레이딩 또는 기타 유형의 조언이나 권장 사항으로 간주되지 않으며, 트레이딩뷰에서 제공하거나 보증하는 것이 아닙니다. 자세한 내용은 이용 약관을 참조하세요.
오픈 소스 스크립트
트레이딩뷰의 진정한 정신에 따라, 이 스크립트의 작성자는 이를 오픈소스로 공개하여 트레이더들이 기능을 검토하고 검증할 수 있도록 했습니다. 작성자에게 찬사를 보냅니다! 이 코드는 무료로 사용할 수 있지만, 코드를 재게시하는 경우 하우스 룰이 적용된다는 점을 기억하세요.
면책사항
해당 정보와 게시물은 금융, 투자, 트레이딩 또는 기타 유형의 조언이나 권장 사항으로 간주되지 않으며, 트레이딩뷰에서 제공하거나 보증하는 것이 아닙니다. 자세한 내용은 이용 약관을 참조하세요.