OPEN-SOURCE SCRIPT
Volume +OBV + ADX
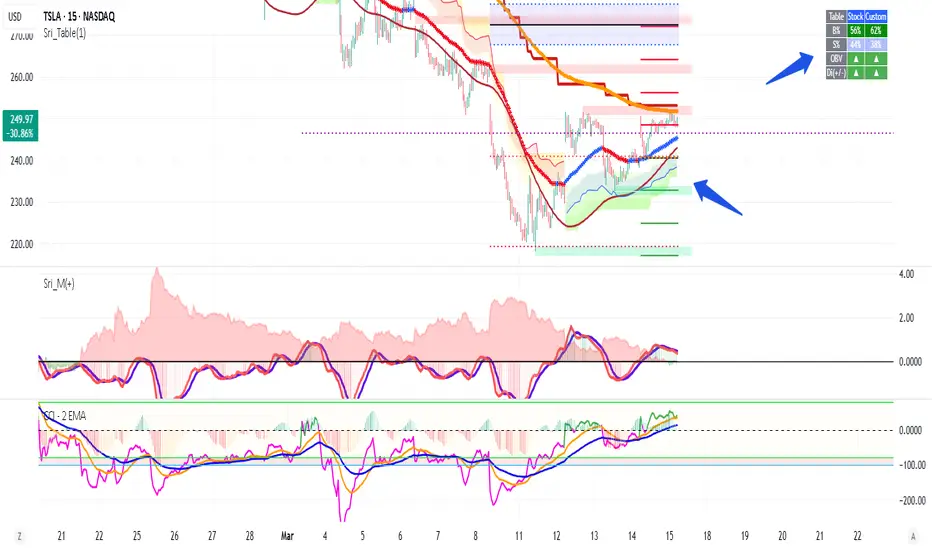
Volume + OBV + ADX Table
Optimized Buyer & Seller Volume with Trend Indications
Overview:
This indicator provides a comprehensive view of market participation and trend strength by integrating Volume, On Balance Volume (OBV) trends, and ADX (Average Directional Index) signals into a visually structured table. Designed for quick decision-making, it highlights buyer and seller dominance while comparing the selected stock with another custom symbol.
Features:
✅ Buyer & Seller Volume Analysis:
Computes buyer and seller volume percentages based on market movements.
Displays daily cumulative volume statistics to assess ongoing market participation.
✅ On Balance Volume (OBV) Trends:
Identifies positive, negative, or neutral OBV trends using an advanced smoothing mechanism.
Highlights accumulation or distribution phases with colored visual cues.
✅ ADX-Based Trend Confirmation:
Evaluates Directional Indicators (DI+ and DI-) to determine the trend direction.
Uses customizable ADX settings to filter out weak trends.
Provides uptrend, downtrend, or neutral signals based on strength conditions.
✅ Custom Symbol Comparison:
Allows users to compare two different assets (e.g., a stock vs. an index or ETF).
Displays a side-by-side comparison of volume dynamics and trend strength.
✅ User-Friendly Table Display:
Presents real-time calculations in a compact and structured table format.
Uses color-coded trend signals for easier interpretation.
Recommended Usage for Best Results:
📌 Pairing this indicator with Sri_Momentum and Sri(+) Pivot will enhance accuracy and provide better trade confirmations.
📌 Adding other major indicators like RSI, CCI, etc., will further increase the probability of winning trades.
How to Use:
Select a custom symbol for comparison.
Adjust ADX settings based on market conditions.
Analyze the table to identify buyer/seller dominance, OBV trends, and ADX trend strength.
Use the combined signals to confirm trade decisions and market direction.
Best Use Cases:
🔹 Trend Confirmation – Validate breakout or reversal signals.
🔹 Volume Strength Analysis – Assess buyer/seller participation before entering trades.
🔹 Multi-Asset Comparison – Compare the behavior of two related instruments.
This indicator is ideal for traders looking to combine volume dynamics with trend-following strategies. 🚀📈
오픈 소스 스크립트
트레이딩뷰의 진정한 정신에 따라, 이 스크립트의 작성자는 이를 오픈소스로 공개하여 트레이더들이 기능을 검토하고 검증할 수 있도록 했습니다. 작성자에게 찬사를 보냅니다! 이 코드는 무료로 사용할 수 있지만, 코드를 재게시하는 경우 하우스 룰이 적용된다는 점을 기억하세요.
면책사항
해당 정보와 게시물은 금융, 투자, 트레이딩 또는 기타 유형의 조언이나 권장 사항으로 간주되지 않으며, 트레이딩뷰에서 제공하거나 보증하는 것이 아닙니다. 자세한 내용은 이용 약관을 참조하세요.
오픈 소스 스크립트
트레이딩뷰의 진정한 정신에 따라, 이 스크립트의 작성자는 이를 오픈소스로 공개하여 트레이더들이 기능을 검토하고 검증할 수 있도록 했습니다. 작성자에게 찬사를 보냅니다! 이 코드는 무료로 사용할 수 있지만, 코드를 재게시하는 경우 하우스 룰이 적용된다는 점을 기억하세요.
면책사항
해당 정보와 게시물은 금융, 투자, 트레이딩 또는 기타 유형의 조언이나 권장 사항으로 간주되지 않으며, 트레이딩뷰에서 제공하거나 보증하는 것이 아닙니다. 자세한 내용은 이용 약관을 참조하세요.