INVITE-ONLY SCRIPT
업데이트됨 GCMML [Orderflowing]
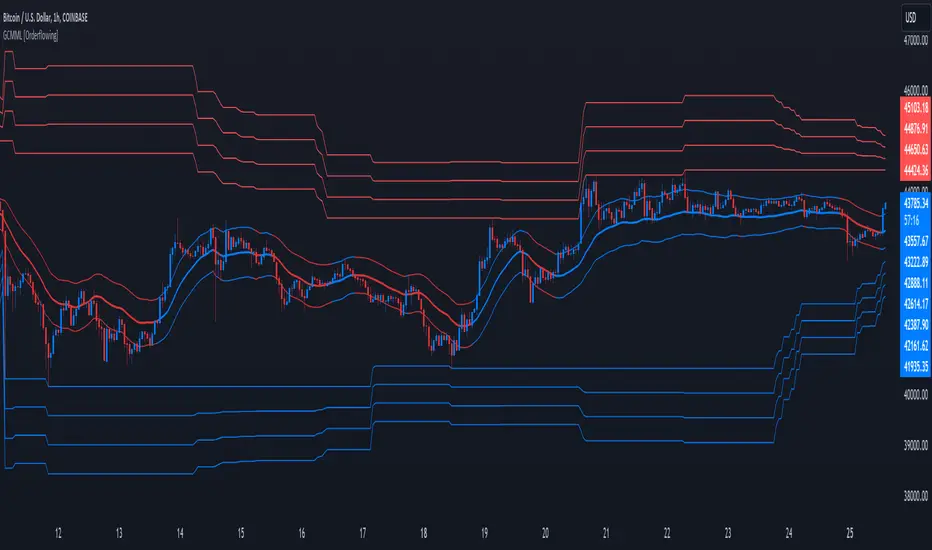
GCMML | Gaussian Channel Murray Math Lines | Trend Analysis | Extremity Analysis
Built using Pine Script V5.
Introduction
The GCMML (Gaussian Channel & Murray Math Lines) Indicator is a TA tool that combines the precision of Gaussian Channels with the strategic insights of Murray Math Lines (MMLE).
This indicator is designed for traders seeking analysis of market trends and volatility while also keeping an eye on extreme pivot levels, offering a unique mix of technical analysis methods.
Innovation and Inspiration
Thank you Matt S. for the idea to create this indicator: tradingview.com/u/MPS_BITCOIN/
GCMML is inspired by the need to integrate the robustness of Gaussian Channels with the extremities of MMLE.
This hybrid approach provides traders with a more nuanced tool for market analysis.
The innovation lies in seamlessly blending these two methodologies to offer a trend & volatility perspective.
Core Features
Input Parameters
Functionality
Analysis and Interpretation
Usage and Applications
Example - Only Displaying the Gaussian Channel:

Example - Disable Fast Response & Reduced Lag Mode:

Example - Multi-Timeframe (6H Calculation / 4H Chart - 32Bars MMLE - GC Default Settings):

The Value
GCMML stands out as a unique and valuable technical analysis tool.
Its innovative combination of Gaussian Channels and MMLE, along with customizable settings, gives the trader an edge in market analysis.
The indicator's ability to provide customizable analysis justifies its position as a closed-source product.
Conclusion
The GCMML indicator is a new dual tool that offers traders a method to analyze market trends and volatility. Its approach of combining Gaussian Channels with MMLE provides a comprehensive view of the market, making it a niche addition to a trader's toolkit.
It is recommended to use GCMML in conjunction with other trading strategies.
It is not recommended to use the GCMML by itself for trading decisions.
Built using Pine Script V5.
Introduction
The GCMML (Gaussian Channel & Murray Math Lines) Indicator is a TA tool that combines the precision of Gaussian Channels with the strategic insights of Murray Math Lines (MMLE).
This indicator is designed for traders seeking analysis of market trends and volatility while also keeping an eye on extreme pivot levels, offering a unique mix of technical analysis methods.
Innovation and Inspiration
Thank you Matt S. for the idea to create this indicator: tradingview.com/u/MPS_BITCOIN/
GCMML is inspired by the need to integrate the robustness of Gaussian Channels with the extremities of MMLE.
This hybrid approach provides traders with a more nuanced tool for market analysis.
The innovation lies in seamlessly blending these two methodologies to offer a trend & volatility perspective.
Core Features
- Gaussian Channel: Uses Gaussian Channels for trend analysis, offering a view of market direction and potential reversals.
- Murray Math Lines (MMLE): Incorporates MMLE for precise support and resistance levels, used for pivotal decision-making.
- Customizable Settings: Offers flexibility in setting the number of bars for MMLE, type of moving average for Gaussian Channels, and various other parameters to tailor the indicator to individual trading styles.
Input Parameters
- MMLE Settings: Adjust the number of bars, level display options, and price wick inclusion for MMLE calculations.
- Gaussian Channel Settings: Choose the number of poles, sampling period, and multiplier for the Gaussian Channel. Options for less lag or fast modes for custom analysis.
- Smoothing Options: Select from various smoothing methods like HMA, SMA, EMA, WMA, DEMA, and TEMA for color change in the Gaussian Channel.
Functionality
- Adaptive Analysis: Dynamically adjusts to market conditions, providing relevant insights through the Gaussian Channel and MMLE.
- Visual: Offers clear visual cues through color-coded bands and levels, aiding in quick interpretation of market trends and potential pivot points.
Analysis and Interpretation
- Market Trends: The Gaussian Channel provides a visual representation of the market trend, with color changes indicating shifts in momentum.
- Support and Resistance: MMLE levels offer critical insights into potential support and resistance areas, guiding traders in making informed decisions.
Usage and Applications
- Trend Identification: Use the Gaussian Channel for identifying market trends and potential reversal points.
- Strategic Decision-Making: Leverage MMLE levels for setting stop-losses, take-profits, and identifying entry and exit points.
- Comprehensive Market Analysis: Combine insights from both Gaussian Channels and MMLE for a more thorough analysis of market movements.
Example - Only Displaying the Gaussian Channel:
Example - Disable Fast Response & Reduced Lag Mode:
Example - Multi-Timeframe (6H Calculation / 4H Chart - 32Bars MMLE - GC Default Settings):
The Value
GCMML stands out as a unique and valuable technical analysis tool.
Its innovative combination of Gaussian Channels and MMLE, along with customizable settings, gives the trader an edge in market analysis.
The indicator's ability to provide customizable analysis justifies its position as a closed-source product.
Conclusion
The GCMML indicator is a new dual tool that offers traders a method to analyze market trends and volatility. Its approach of combining Gaussian Channels with MMLE provides a comprehensive view of the market, making it a niche addition to a trader's toolkit.
It is recommended to use GCMML in conjunction with other trading strategies.
It is not recommended to use the GCMML by itself for trading decisions.
릴리즈 노트
V1.1 - Pine Script™ v6 Update초대 전용 스크립트
이 스크립트는 작성자가 승인한 사용자만 접근할 수 있습니다. 사용하려면 요청 후 승인을 받아야 하며, 일반적으로 결제 후에 허가가 부여됩니다. 자세한 내용은 아래 작성자의 안내를 따르거나 Orderflowing에게 직접 문의하세요.
트레이딩뷰는 스크립트의 작동 방식을 충분히 이해하고 작성자를 완전히 신뢰하지 않는 이상, 해당 스크립트에 비용을 지불하거나 사용하는 것을 권장하지 않습니다. 커뮤니티 스크립트에서 무료 오픈소스 대안을 찾아보실 수도 있습니다.
작성자 지시 사항
To start using this script, please visit our site: https://orderflowing.com for access.
William | Orderflowing
Develop Edge For Markets™
Indicators:
tradingview.com/u/Orderflowing/
orderflowing.com/indicators
Get Instant Access: orderflowing.com/pricing
Develop Edge For Markets™
Indicators:
tradingview.com/u/Orderflowing/
orderflowing.com/indicators
Get Instant Access: orderflowing.com/pricing
면책사항
해당 정보와 게시물은 금융, 투자, 트레이딩 또는 기타 유형의 조언이나 권장 사항으로 간주되지 않으며, 트레이딩뷰에서 제공하거나 보증하는 것이 아닙니다. 자세한 내용은 이용 약관을 참조하세요.
초대 전용 스크립트
이 스크립트는 작성자가 승인한 사용자만 접근할 수 있습니다. 사용하려면 요청 후 승인을 받아야 하며, 일반적으로 결제 후에 허가가 부여됩니다. 자세한 내용은 아래 작성자의 안내를 따르거나 Orderflowing에게 직접 문의하세요.
트레이딩뷰는 스크립트의 작동 방식을 충분히 이해하고 작성자를 완전히 신뢰하지 않는 이상, 해당 스크립트에 비용을 지불하거나 사용하는 것을 권장하지 않습니다. 커뮤니티 스크립트에서 무료 오픈소스 대안을 찾아보실 수도 있습니다.
작성자 지시 사항
To start using this script, please visit our site: https://orderflowing.com for access.
William | Orderflowing
Develop Edge For Markets™
Indicators:
tradingview.com/u/Orderflowing/
orderflowing.com/indicators
Get Instant Access: orderflowing.com/pricing
Develop Edge For Markets™
Indicators:
tradingview.com/u/Orderflowing/
orderflowing.com/indicators
Get Instant Access: orderflowing.com/pricing
면책사항
해당 정보와 게시물은 금융, 투자, 트레이딩 또는 기타 유형의 조언이나 권장 사항으로 간주되지 않으며, 트레이딩뷰에서 제공하거나 보증하는 것이 아닙니다. 자세한 내용은 이용 약관을 참조하세요.