OPEN-SOURCE SCRIPT
업데이트됨 AlphaDragon: Data visualizer
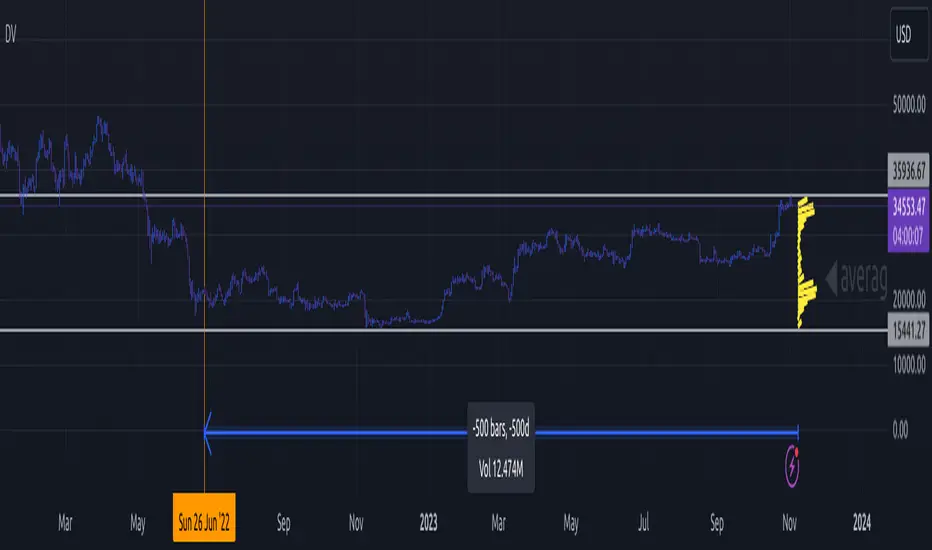
Aggregates source data into 2D vertical histogram.
Aggregates samples (lenght) in a window (from 0% to 100%). N samples are gathered in 1% brackets.
Visualizer gathers 5% of each window, and display width corresponding to amount of samples, in that bracket.
Aggregates samples (lenght) in a window (from 0% to 100%). N samples are gathered in 1% brackets.
Visualizer gathers 5% of each window, and display width corresponding to amount of samples, in that bracket.
릴리즈 노트
Added math.round - but it does not fix the graph draw릴리즈 노트
Updated histogramin next version:
- projected two types of histogram
- Better, its own X/Y chart (one type)
- Updated this 2D as an overlay
릴리즈 노트
updated chart오픈 소스 스크립트
트레이딩뷰의 진정한 정신에 따라, 이 스크립트의 작성자는 이를 오픈소스로 공개하여 트레이더들이 기능을 검토하고 검증할 수 있도록 했습니다. 작성자에게 찬사를 보냅니다! 이 코드는 무료로 사용할 수 있지만, 코드를 재게시하는 경우 하우스 룰이 적용된다는 점을 기억하세요.
면책사항
해당 정보와 게시물은 금융, 투자, 트레이딩 또는 기타 유형의 조언이나 권장 사항으로 간주되지 않으며, 트레이딩뷰에서 제공하거나 보증하는 것이 아닙니다. 자세한 내용은 이용 약관을 참조하세요.
오픈 소스 스크립트
트레이딩뷰의 진정한 정신에 따라, 이 스크립트의 작성자는 이를 오픈소스로 공개하여 트레이더들이 기능을 검토하고 검증할 수 있도록 했습니다. 작성자에게 찬사를 보냅니다! 이 코드는 무료로 사용할 수 있지만, 코드를 재게시하는 경우 하우스 룰이 적용된다는 점을 기억하세요.
면책사항
해당 정보와 게시물은 금융, 투자, 트레이딩 또는 기타 유형의 조언이나 권장 사항으로 간주되지 않으며, 트레이딩뷰에서 제공하거나 보증하는 것이 아닙니다. 자세한 내용은 이용 약관을 참조하세요.