PROTECTED SOURCE SCRIPT
JPCOQ Ichimoku V2
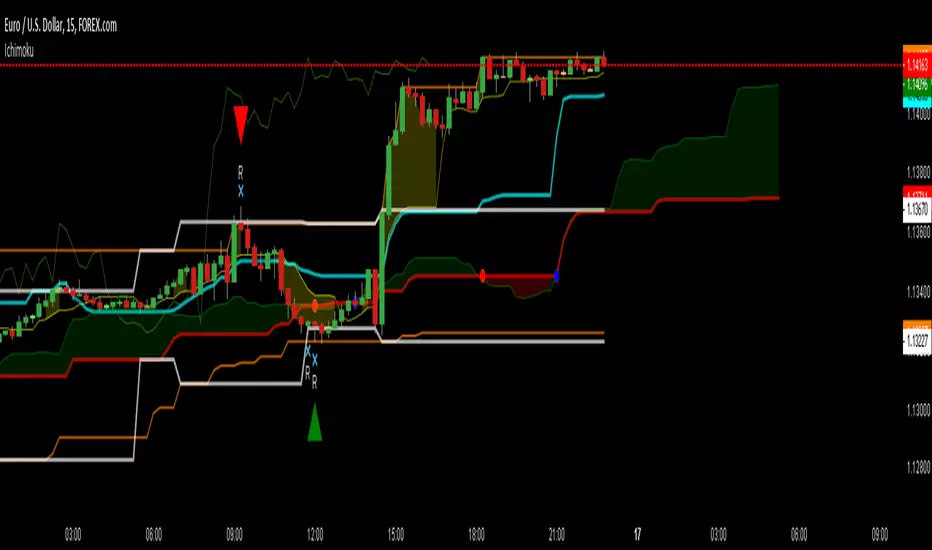
INDICATORS:
Show Yellow zone between price and tenkan when oversold/overbought
Show splits : white when to come, yellow when occurs, red when occurs with a flat Senkou Span B, blue when occurs with a flat Senkou Span B and kijun
Show probable range in white lines
Show last higher highs & lower lows in orange lines
SIGNALS (when ichimoku meet candle patterns)
L/H = rebound signals on higher highs / Lower Lows, target can be lower kj flat
C = potential rebound on overbought oversold zone, target can be lower kj flat
R = rebound signal on range edges, target can be last split
B = pullback/throwback rebound after break out of probable range, target can be last higher high (lower low)
K = rebound on Kj in a trend (out of range), target can be last higher high (lower low)
OTHER PARAMETERS
checkHaram = take Harami pattern into account
CheckallCandle = include all candle patterns
checkVol = show "V" when volume is higher than last 9 periods average
showFuture = next kijun/ssa/ssb values in thin lines
closeToChikou = the greater the value close to ichimoku lines is the test
showChikou = red cross on price when close to chikou in TF or upper one
Flatlen = bars of same value to validate an ichimoku flat
CheckSignal1 = check and show upper TF signals => manual check because not perfect, to unset when study error message !!
ShowEntry = green buy signal (red sell) when buy signal and chikou free and ratio >=2
보호된 스크립트입니다
이 스크립트는 비공개 소스로 게시됩니다. 하지만 이를 자유롭게 제한 없이 사용할 수 있습니다 – 자세한 내용은 여기에서 확인하세요.
면책사항
해당 정보와 게시물은 금융, 투자, 트레이딩 또는 기타 유형의 조언이나 권장 사항으로 간주되지 않으며, 트레이딩뷰에서 제공하거나 보증하는 것이 아닙니다. 자세한 내용은 이용 약관을 참조하세요.
면책사항
해당 정보와 게시물은 금융, 투자, 트레이딩 또는 기타 유형의 조언이나 권장 사항으로 간주되지 않으며, 트레이딩뷰에서 제공하거나 보증하는 것이 아닙니다. 자세한 내용은 이용 약관을 참조하세요.