INVITE-ONLY SCRIPT
Merek Equal Highs and Lows
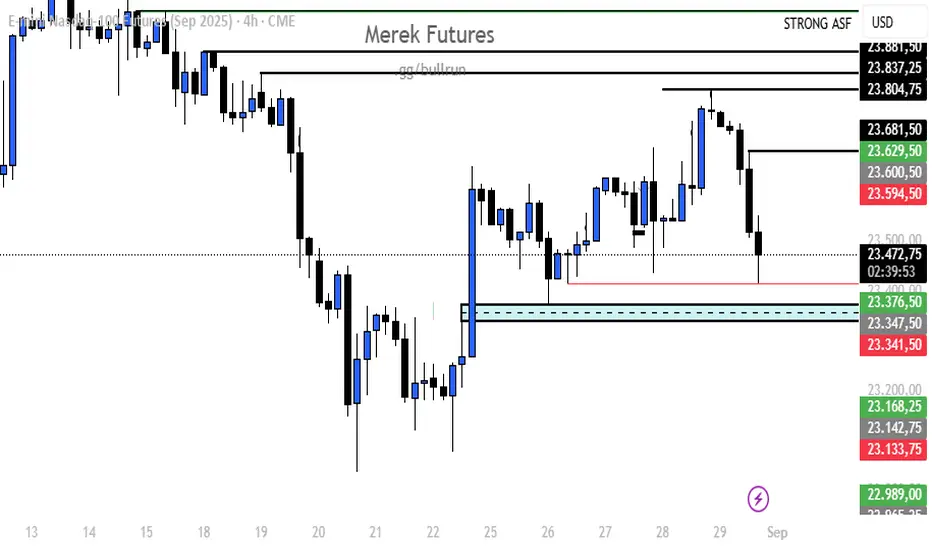
EQH – Equal Highs Indicator
Description:
The EQH indicator detects Equal Highs on the chart. This occurs when price reaches the same high level two or more times without breaking it decisively.
Interpretation:
Liquidity zone: Equal highs are often seen as areas where liquidity (stop-loss clusters) is located.
Breakout potential: A break above this level often signals that liquidity is being taken before either a reversal or continuation of the trend.
Market structure: EQH highlights resistance areas that can serve as key decision points for traders.
Use cases:
Identifying potential stop-hunt zones
Spotting resistance levels
Anticipating liquidity grabs before reversals or trend continuations
EQL – Equal Lows Indicator
Description:
The EQL indicator detects Equal Lows on the chart. This occurs when price reaches the same low level two or more times without breaking lower.
Interpretation:
Liquidity zone: Equal lows are areas where liquidity (sell-side stops) tends to accumulate.
Breakout potential: A move below this level often indicates liquidity being swept before a possible reversal or continuation.
Market structure: EQL highlights support areas that can be critical for trade decisions.
Use cases:
Identifying sell-side liquidity zones
Spotting support levels
Recognizing possible stop-hunts before reversals or trend continuations
Description:
The EQH indicator detects Equal Highs on the chart. This occurs when price reaches the same high level two or more times without breaking it decisively.
Interpretation:
Liquidity zone: Equal highs are often seen as areas where liquidity (stop-loss clusters) is located.
Breakout potential: A break above this level often signals that liquidity is being taken before either a reversal or continuation of the trend.
Market structure: EQH highlights resistance areas that can serve as key decision points for traders.
Use cases:
Identifying potential stop-hunt zones
Spotting resistance levels
Anticipating liquidity grabs before reversals or trend continuations
EQL – Equal Lows Indicator
Description:
The EQL indicator detects Equal Lows on the chart. This occurs when price reaches the same low level two or more times without breaking lower.
Interpretation:
Liquidity zone: Equal lows are areas where liquidity (sell-side stops) tends to accumulate.
Breakout potential: A move below this level often indicates liquidity being swept before a possible reversal or continuation.
Market structure: EQL highlights support areas that can be critical for trade decisions.
Use cases:
Identifying sell-side liquidity zones
Spotting support levels
Recognizing possible stop-hunts before reversals or trend continuations
초대 전용 스크립트
이 스크립트는 작성자가 승인한 사용자만 접근할 수 있습니다. 사용하려면 요청 후 승인을 받아야 하며, 일반적으로 결제 후에 허가가 부여됩니다. 자세한 내용은 아래 작성자의 안내를 따르거나 Merek_Real에게 직접 문의하세요.
트레이딩뷰는 스크립트의 작동 방식을 충분히 이해하고 작성자를 완전히 신뢰하지 않는 이상, 해당 스크립트에 비용을 지불하거나 사용하는 것을 권장하지 않습니다. 커뮤니티 스크립트에서 무료 오픈소스 대안을 찾아보실 수도 있습니다.
작성자 지시 사항
EQL and EQH Indicator for free from merek
면책사항
해당 정보와 게시물은 금융, 투자, 트레이딩 또는 기타 유형의 조언이나 권장 사항으로 간주되지 않으며, 트레이딩뷰에서 제공하거나 보증하는 것이 아닙니다. 자세한 내용은 이용 약관을 참조하세요.