INVITE-ONLY SCRIPT
shock detecter [WS]
It is paid version.
if you want free version

usually volaility and volume come together,
but if volume is high and volatility is low,
than blue bar increase.
I named it "abnormal volume shock"
so,
blue signal come only if low volatility + high volume.
blue can come when the price is top(or bottom) but this is not a buy(or sell) signal.
(remember, blue is just a strange moment. high volume + low volatility is not a normal situation. you better to focus "why suddenly volume increased" )
briefly,
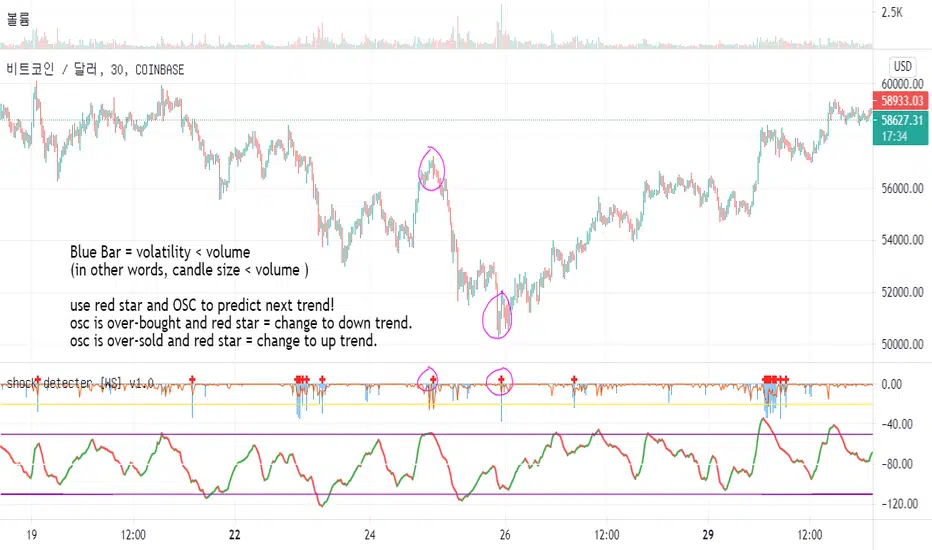
Blue Bar = volatility < volume
(in other words, candle size < volume )
use red star and OSC to predict next trend!
osc is over-bought and red star = change to down trend.
osc is over-sold and red star = change to up trend.
if simple_mode off,
green star = volume shock
orange star = volume shock over threshold (20)
green bar = volatility shock
yellow star = volatility shock over threshold (20)
red bar = volatility reducing (convergence)
white star = end of convergence
if you want free version
usually volaility and volume come together,
but if volume is high and volatility is low,
than blue bar increase.
I named it "abnormal volume shock"
so,
blue signal come only if low volatility + high volume.
blue can come when the price is top(or bottom) but this is not a buy(or sell) signal.
(remember, blue is just a strange moment. high volume + low volatility is not a normal situation. you better to focus "why suddenly volume increased" )
briefly,
Blue Bar = volatility < volume
(in other words, candle size < volume )
use red star and OSC to predict next trend!
osc is over-bought and red star = change to down trend.
osc is over-sold and red star = change to up trend.
if simple_mode off,
green star = volume shock
orange star = volume shock over threshold (20)
green bar = volatility shock
yellow star = volatility shock over threshold (20)
red bar = volatility reducing (convergence)
white star = end of convergence
초대 전용 스크립트
이 스크립트는 작성자가 승인한 사용자만 접근할 수 있습니다. 사용하려면 요청 후 승인을 받아야 하며, 일반적으로 결제 후에 허가가 부여됩니다. 자세한 내용은 아래 작성자의 안내를 따르거나 shm837에게 직접 문의하세요.
트레이딩뷰는 스크립트의 작동 방식을 충분히 이해하고 작성자를 완전히 신뢰하지 않는 이상, 해당 스크립트에 비용을 지불하거나 사용하는 것을 권장하지 않습니다. 커뮤니티 스크립트에서 무료 오픈소스 대안을 찾아보실 수도 있습니다.
작성자 지시 사항
구글 또는 다움에서 화이트스타트 검색
면책사항
해당 정보와 게시물은 금융, 투자, 트레이딩 또는 기타 유형의 조언이나 권장 사항으로 간주되지 않으며, 트레이딩뷰에서 제공하거나 보증하는 것이 아닙니다. 자세한 내용은 이용 약관을 참조하세요.