OPEN-SOURCE SCRIPT
Dividend-to-ROE Ratio
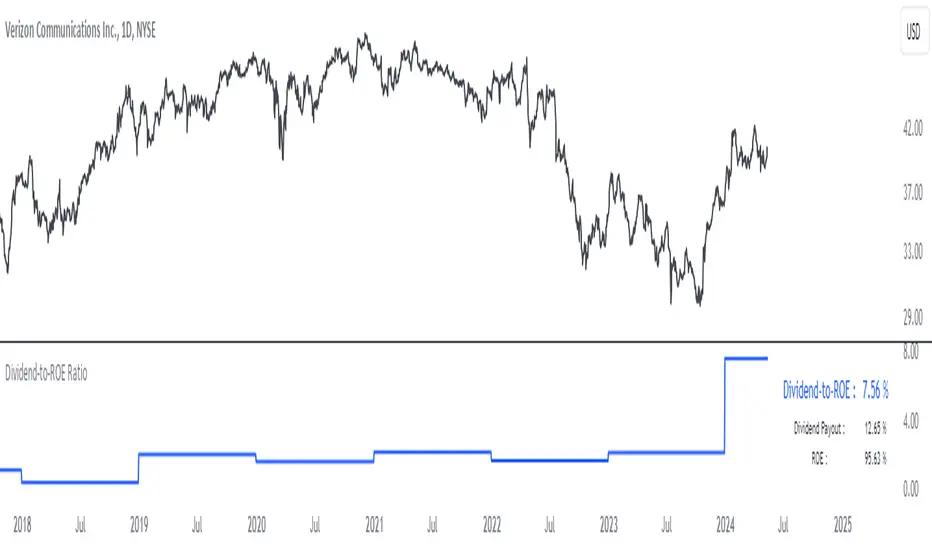
Dividend-to-ROE Ratio Indicator
The Dividend-to-ROE Ratio indicator offers valuable insights into a company's dividend distribution relative to its profitability, specifically comparing the Dividend Payout Ratio (proportion of earnings as dividends) to the Return on Equity (ROE), a measure of profitability from shareholder equity.
Interpretation:
1. Higher Ratio: A higher Dividend-to-ROE Ratio suggests a stable dividend policy, where a significant portion of earnings is returned to shareholders. This can indicate consistent dividend payments, often appealing to income-seeking investors.
2. Lower Ratio: Conversely, a lower ratio implies that the company retains more earnings for growth, potentially signaling a focus on reinvestment for future expansion rather than immediate dividend payouts.
3. Excessively High Ratio: An exceptionally high ratio may raise concerns. While it could reflect a generous dividend policy, excessively high ratios might indicate that a company is distributing more earnings than it can sustainably afford. This could potentially hinder the company's ability to reinvest in its operations, research, or navigate economic downturns effectively.
Utility and Applications:
The Dividend-to-ROE Ratio can be particularly useful in the following scenarios:
1. Income-Oriented Investors: For investors seeking consistent dividend income, a higher ratio signifies a company's commitment to distributing profits to shareholders, potentially aligning with income-oriented investment strategies.
2. Financial Health Assessment: Analysts and stakeholders can use this ratio to gauge a company's financial health and dividend sustainability. It provides insights into management's capital allocation decisions and strategic focus.
3. Comparative Analysis: When comparing companies within the same industry, this ratio helps in benchmarking dividend policies and identifying outliers with unusually high or low ratios.
Considerations:
1. Contextual Analysis: Interpretation should be contextualized within industry standards and the company's financial history. Comparing the ratio with peers in the same sector can provide meaningful insights.
2. Financial Health: It's crucial to evaluate this indicator alongside other financial metrics (like cash flow, debt levels, and profit margins) to grasp the company's overall financial health and sustainability of its dividend policy.
Disclaimer: This indicator is for informational purposes only and does not constitute financial advice. Investors should conduct thorough research and consult with financial professionals before making investment decisions based on this ratio.
오픈 소스 스크립트
트레이딩뷰의 진정한 정신에 따라, 이 스크립트의 작성자는 이를 오픈소스로 공개하여 트레이더들이 기능을 검토하고 검증할 수 있도록 했습니다. 작성자에게 찬사를 보냅니다! 이 코드는 무료로 사용할 수 있지만, 코드를 재게시하는 경우 하우스 룰이 적용된다는 점을 기억하세요.
Plan the trade ⚡ Trade the plan
면책사항
해당 정보와 게시물은 금융, 투자, 트레이딩 또는 기타 유형의 조언이나 권장 사항으로 간주되지 않으며, 트레이딩뷰에서 제공하거나 보증하는 것이 아닙니다. 자세한 내용은 이용 약관을 참조하세요.