PROTECTED SOURCE SCRIPT
업데이트됨 Earnings, Sales & Volume Dashboard [LevelUp]
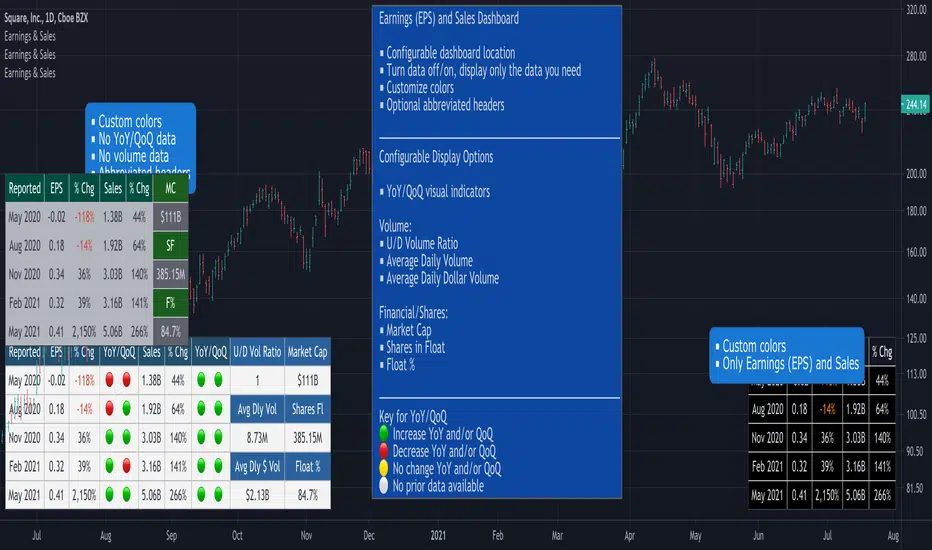
View quarterly earnings per share (EPS) and sales data. Optional visual icons can be shown comparing data on a Year-over-Year (YoY) and/or Quarter-on-Quarter (QoQ) basis.
YoY: quarterly earnings/sales compared to the value in the same quarter of the previous year.
QoQ: quarterly earnings/sales compared to the value of the previous quarter.
Earnings Calculation - Basic EPS vs Diluted
This indicator uses basic EPS data to calculate earnings. For relatively new issues (IPOs, etc), some platforms/tools may use diluted EPS data as a means to account for outstanding stock options, convertible preferred shares, etc. In this scenario, you will notice differences in the earnings information.
Features
■ View quarterly earnings per share (EPS) and sales data.
■ Configure colors for dashboard header and rows.
■ Change location of dashboard.
■ Choose which charts display the dashboard (daily, weekly or monthly).
Pro Tip: Show the dashboard on top of other chart elements:
- Right click on the indicator
- Select 'Visual Order'
- Select 'Bring to Front'
릴리즈 노트
Version 2.0What's New:
■ Support for Depositary Receipts, which trade like stocks and have earnings and sales data.
릴리즈 노트
Version 3.0What's New:
■ EPS and Sales values and percent change
■ Customize color for negative percent change
릴리즈 노트
Version 4.0What's New:
■ Sales values are rounded to two decimal places (hundredths).
릴리즈 노트
Version 5.0What's New:
■ Minor change to the layout of the visual icons.
릴리즈 노트
Version 6.0Additional Volume Data on Daily and/or Weekly Charts:
■ U/D Volume Ratio
■ Average Daily Volume
■ Average Daily Dollar Volume
Additional Financial/Share Data on Daily and/or Weekly Charts:
■ Market Cap
■ Shares in Float
■ Float %
Turn additional data on/off, view only the information that you find helpful.
릴리즈 노트
Version 7.0■ Plot EPS onto the chart as a line, symbol or both.
릴리즈 노트
Version 8.0■ Option to hide EPS, Sales & Volume table.
■ Plot EPS symbols along the bottom of the chart.
릴리즈 노트
Version 9.0■ Minor updates to plotting of EPS when using line and/or symbols.
릴리즈 노트
Version 10.0■ Changes to EPS and Sales calculations when there is limited historical data available.
릴리즈 노트
Version 11.0■ Add additional options for text size.
릴리즈 노트
Version 12.0■ Updates to earnings data. Infrequent issue of random missing data has been fixed.
릴리즈 노트
Version 13.0▪ Add support for 'fund' stock type. With this change, stats for REITs are now available.
보호된 스크립트입니다
이 스크립트는 비공개 소스로 게시됩니다. 하지만 이를 자유롭게 제한 없이 사용할 수 있습니다 – 자세한 내용은 여기에서 확인하세요.
Join traders in over 40 countries and LevelUp!
tradingview.com/spaces/LevelUpTools/
tradingview.com/spaces/LevelUpTools/
면책사항
해당 정보와 게시물은 금융, 투자, 트레이딩 또는 기타 유형의 조언이나 권장 사항으로 간주되지 않으며, 트레이딩뷰에서 제공하거나 보증하는 것이 아닙니다. 자세한 내용은 이용 약관을 참조하세요.