PROTECTED SOURCE SCRIPT
업데이트됨 [DMG] REVEREND v2
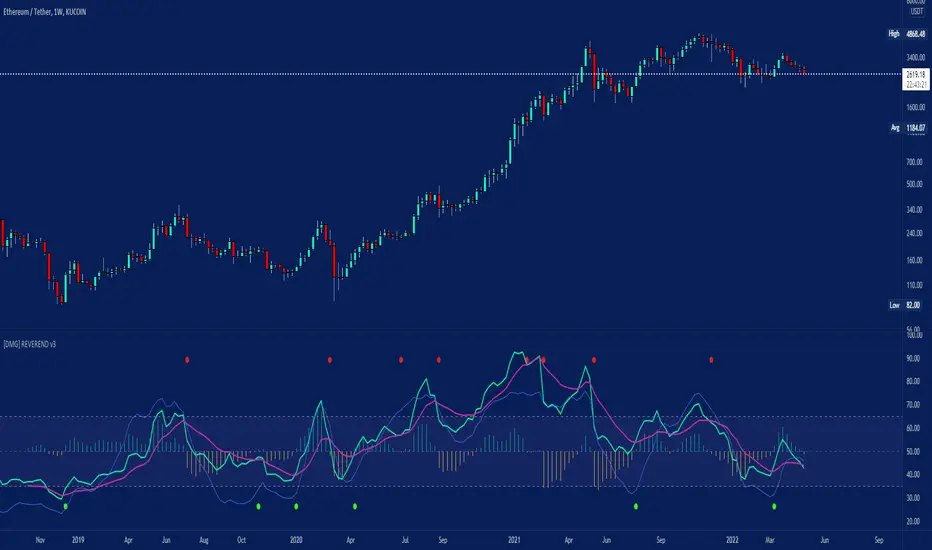
REVEREND (RSI based Trend Reversal Indicator)
Info:
This is an RSI based convergence divergence (like MACD) indicator using SMAs or DEMAs for smoothing.
You can optionally filter the signals with the stochastic momentum indicator (SMI) levels or via simple overbought/oversold RSI levels.
Signals:
Purple is the Slow MA, Green is the Fast MA, Blue is the SMI (Momentum).
Buy and Sell signals are shown as circles (yellow on top sell, green on bottom buy)
The histogram is for easier differentiation (like macd) zero crossings creating the signals.
Usage:
Settings can never be perfect for any indicator, defaults should be good for BTC, ETH.
Sell signals should be taken with falling momentum, buys with rising momentum.
Watch out for false signals if Momentum is still rising while it prints a sell signal it is most likely false, you can filter these by using longer MAs but then it becomes more lagging.
A sufficiently fast fast-MA can be used for tracking RSI itself and since it also displays the stoch. momentum signal you can also check for divergences yourself or anticipate moves by their slope.
This is my main indicator for a year now and I wish I had followed it more ;) I additionally use EMAs, VWAP, Divergences and Volume Indicators, just remember price is king.
If you have questions or additional ideas I'd be happy to read them!
Good Luck! :D
릴리즈 노트
REVEREND ( RSI based Trend Reversal Indicator)Info:
This is an RSI based convergence divergence (like MACD ) indicator using SMAs or DEMAs for smoothing.
You can optionally filter the signals with the stochastic momentum indicator (SMI) levels or via simple overbought/oversold RSI levels.
Signals:
Purple is the Slow MA, Green is the Fast MA, Blue is the SMI (Momentum).
Buy and Sell signals are shown as circles (yellow on top sell, green on bottom buy)
The histogram is for easier differentiation (like macd ) zero crossings creating the signals.
Usage:
Settings can never be perfect for any indicator, defaults should be good for BTC , ETH.
Sell signals should be taken with falling momentum, buys with rising momentum.
Watch out for false signals if Momentum is still rising while it prints a sell signal it is most likely false, you can filter these by using longer MAs but then it becomes more lagging.
A sufficiently fast fast-MA can be used for tracking RSI itself and since it also displays the stoch . momentum signal you can also check for divergences yourself or anticipate moves by their slope.
This is my main indicator for a year now and I wish I had followed it more ;) I additionally use EMAs, VWAP , Divergences and Volume Indicators, just remember price is king.
If you have questions or additional ideas I'd be happy to read them!
Good Luck! :D
Update v3:
I simplified the UI a bit, made the filters faster, bigger buy/sell icons, edited the defaults so they are a bit better for higher timeframes by default.
Generally you will need to change the settings to accomodate your trading timeframe and use a dataset that has enough history for your settings, this is true for most indicators.
The faster your settings on the MAs and the jumpier the stochastic the more false signals, the slower the more lag is introduced. Its always a balance.
Thanks for trying around.
Good Luck as always.
릴리즈 노트
Messed something up with the filter activation in the last update, now they all show when unticked. RSI OB/OS filter has been removed because it wasnt very effective. Changed some colors and sizes etc.보호된 스크립트입니다
이 스크립트는 비공개 소스로 게시됩니다. 하지만 이를 자유롭게 제한 없이 사용할 수 있습니다 – 자세한 내용은 여기에서 확인하세요.
면책사항
해당 정보와 게시물은 금융, 투자, 트레이딩 또는 기타 유형의 조언이나 권장 사항으로 간주되지 않으며, 트레이딩뷰에서 제공하거나 보증하는 것이 아닙니다. 자세한 내용은 이용 약관을 참조하세요.
보호된 스크립트입니다
이 스크립트는 비공개 소스로 게시됩니다. 하지만 이를 자유롭게 제한 없이 사용할 수 있습니다 – 자세한 내용은 여기에서 확인하세요.
면책사항
해당 정보와 게시물은 금융, 투자, 트레이딩 또는 기타 유형의 조언이나 권장 사항으로 간주되지 않으며, 트레이딩뷰에서 제공하거나 보증하는 것이 아닙니다. 자세한 내용은 이용 약관을 참조하세요.