OPEN-SOURCE SCRIPT
업데이트됨 TRI - Support/Resistance Zones
TRI - SUPPORT/RESISTANCE ZONES v1.0
DESCRIPTION:
Professional support and resistance level indicator based on body pivot analysis.
Unlike traditional indicators that use wicks (high/low), this tool identifies key levels
using candle bodies (open/close), providing more reliable and significant price zones.
KEY FEATURES:
HOW IT WORKS:
The indicator scans historical price action to identify pivot points based on candle bodies.
Only valid levels (not breached since formation) are displayed. Levels are automatically
filtered by proximity to avoid visual clutter while maintaining the most relevant zones.
Breakout alerts trigger when price closes above resistance or below support.
BEST USE:
Ideal for swing trading, day trading, and identifying key decision points.
Works on all timeframes and asset classes.
DESCRIPTION:
Professional support and resistance level indicator based on body pivot analysis.
Unlike traditional indicators that use wicks (high/low), this tool identifies key levels
using candle bodies (open/close), providing more reliable and significant price zones.
KEY FEATURES:
- Body-based pivot detection for more meaningful levels
- Automatic level validation (excludes breached levels)
- Smart level filtering (avoids cluttered charts)
- Configurable number of support/resistance levels (1-5 each)
- Visual customization (colors, transparency, line extension)
- Real-time breakout alerts for resistance and support levels
- Clean and intuitive interface with price labels
HOW IT WORKS:
The indicator scans historical price action to identify pivot points based on candle bodies.
Only valid levels (not breached since formation) are displayed. Levels are automatically
filtered by proximity to avoid visual clutter while maintaining the most relevant zones.
Breakout alerts trigger when price closes above resistance or below support.
BEST USE:
Ideal for swing trading, day trading, and identifying key decision points.
Works on all timeframes and asset classes.
릴리즈 노트
TRI - SUPPORT/RESISTANCE ZONES v1.0DESCRIPTION:
Professional support and resistance level indicator based on body pivot analysis.
Unlike traditional indicators that use wicks (high/low), this tool identifies key levels
using candle bodies (open/close), providing more reliable and significant price zones.
KEY FEATURES:
- Body-based pivot detection for more meaningful levels
- Automatic level validation (excludes breached levels)
- Smart level filtering (avoids cluttered charts)
- Configurable number of support/resistance levels (1-5 each)
- Visual customization (colors, transparency, line extension)
- Real-time breakout alerts for resistance and support levels
- Clean and intuitive interface with price labels
HOW IT WORKS:
The indicator scans historical price action to identify pivot points based on candle bodies.
Only valid levels (not breached since formation) are displayed. Levels are automatically
filtered by proximity to avoid visual clutter while maintaining the most relevant zones.
Breakout alerts trigger when price closes above resistance or below support.
BEST USE:
Ideal for swing trading, day trading, and identifying key decision points.
Works on all timeframes and asset classes.
릴리즈 노트
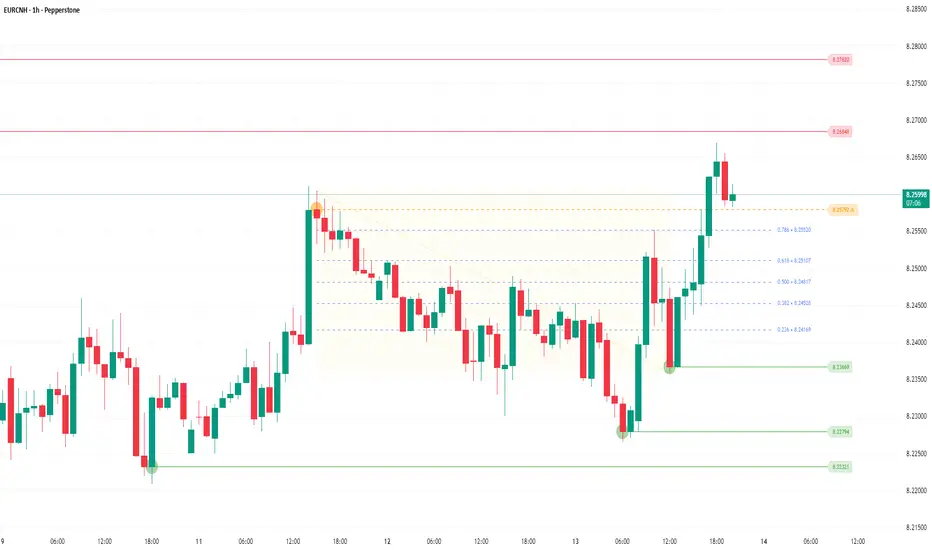
TRI - SUPPORT/RESISTANCE ZONES v1.2DESCRIPTION:
Advanced support and resistance indicator with body-based pivot detection, zigzag visualization,
and automatic Fibonacci retracement levels. Designed for precise technical analysis across all timeframes.
KEY FEATURES:
- Body-based pivot detection (open/close) for more reliable levels vs traditional wick-based methods
- Automatic level validation - excludes breached levels in real-time
- Smart level clustering - merges nearby levels based on ATR/Fixed %/Range
- Zigzag visualization for trend structure analysis
- Automatic Fibonacci retracement levels on last swing (0.236, 0.382, 0.500, 0.618, 0.786)
- Pending pivots detection - shows forming levels before full confirmation
- Configurable sensitivity (Dynamic ATR / Fixed % / Range-based)
- Real-time breakout alerts for resistance and support
- Clean visual design with price labels and customizable colors
HOW IT WORKS:
The indicator identifies pivot highs/lows using candle bodies instead of wicks, providing more significant
price levels. Only unbreached levels are displayed. A zigzag connects confirmed pivots to show market structure.
Fibonacci retracement levels are automatically drawn on the last complete swing when it exceeds the minimum size threshold.
BEST USE:
Works on all timeframes and asset classes. Recommended for DAILY timeframes and higher for swing trading
to identify major support/resistance zones and key retracement levels. Lower timeframes suitable for intraday scalping.
릴리즈 노트
TRI - SUPPORT/RESISTANCE ZONES v1.3DESCRIPTION:
Advanced support and resistance indicator with body-based pivot detection, zigzag visualization,
and automatic Fibonacci retracement levels. Designed for precise technical analysis across all timeframes.
KEY FEATURES:
- Body-based pivot detection (open/close) for more reliable levels vs traditional wick-based methods
- Automatic level validation - excludes breached levels in real-time
- Smart level clustering - merges nearby levels based on ATR/Fixed %/Range
- Zigzag visualization for trend structure analysis
- Automatic Fibonacci retracement levels on last swing (0.236, 0.382, 0.500, 0.618, 0.786)
- Pending pivots detection - shows forming levels before full confirmation
- Configurable sensitivity (Dynamic ATR / Fixed % / Range-based)
- Real-time breakout alerts for resistance and support
- Clean visual design with price labels and customizable colors
HOW IT WORKS:
The indicator identifies pivot highs/lows using candle bodies instead of wicks, providing more significant
price levels. Only unbreached levels are displayed. A zigzag connects confirmed pivots to show market structure.
Fibonacci retracement levels are automatically drawn on the last complete swing when it exceeds the minimum size threshold.
BEST USE:
Works on all timeframes and asset classes. Recommended for DAILY timeframes and higher for swing trading
to identify major support/resistance zones and key retracement levels. Lower timeframes suitable for intraday scalping.
릴리즈 노트
TRI - SUPPORT/RESISTANCE ZONES v1.4DESCRIPTION:
Advanced support and resistance indicator with body-based pivot detection, zigzag visualization,
and automatic Fibonacci retracement levels. Designed for precise technical analysis across all timeframes.
KEY FEATURES:
- Body-based pivot detection (open/close) for more reliable levels vs traditional wick-based methods
- Automatic level validation - excludes breached levels in real-time
- Smart level clustering - merges nearby levels based on ATR/Fixed %/Range
- Zigzag visualization for trend structure analysis
- Automatic Fibonacci retracement levels on last swing (0.236, 0.382, 0.500, 0.618, 0.786)
- Pending pivots detection - shows forming levels before full confirmation
- Configurable sensitivity (Dynamic ATR / Fixed % / Range-based)
- Real-time breakout alerts for resistance and support
- Clean visual design with price labels and customizable colors
HOW IT WORKS:
The indicator identifies pivot highs/lows using candle bodies instead of wicks, providing more significant
price levels. Only unbreached levels are displayed. A zigzag connects confirmed pivots to show market structure.
Fibonacci retracement levels are automatically drawn on the last complete swing when it exceeds the minimum size threshold.
BEST USE:
Works on all timeframes and asset classes. Recommended for DAILY timeframes and higher for swing trading
to identify major support/resistance zones and key retracement levels. Lower timeframes suitable for intraday scalping.
릴리즈 노트
TRI - SUPPORT/RESISTANCE ZONES v1.5DESCRIPTION:
Advanced support and resistance indicator with body-based pivot detection, zigzag visualization,
and automatic Fibonacci retracement levels. Designed for precise technical analysis across all timeframes.
KEY FEATURES:
- Body-based pivot detection (open/close) for more reliable levels vs traditional wick-based methods
- Automatic level validation - excludes breached levels in real-time
- Smart level clustering - merges nearby levels based on ATR/Fixed %/Range
- Zigzag visualization for trend structure analysis
- Automatic Fibonacci retracement levels on last swing (0.236, 0.382, 0.500, 0.618, 0.786)
- Pending pivots detection - shows forming levels before full confirmation
- Configurable sensitivity (Dynamic ATR / Fixed % / Range-based)
- Real-time breakout alerts for resistance and support
- Clean visual design with price labels and customizable colors
HOW IT WORKS:
The indicator identifies pivot highs/lows using candle bodies instead of wicks, providing more significant
price levels. Only unbreached levels are displayed. A zigzag connects confirmed pivots to show market structure.
Fibonacci retracement levels are automatically drawn on the last complete swing when it exceeds the minimum size threshold.
BEST USE:
Works on all timeframes and asset classes. Recommended for DAILY timeframes and higher for swing trading
to identify major support/resistance zones and key retracement levels. Lower timeframes suitable for intraday scalping.
릴리즈 노트
TRI - SUPPORT/RESISTANCE ZONES v1.5.1DESCRIPTION:
Advanced support and resistance indicator with body-based pivot detection, zigzag visualization,
and automatic Fibonacci retracement levels. Designed for precise technical analysis across all timeframes.
KEY FEATURES:
- Body-based pivot detection (open/close) for more reliable levels vs traditional wick-based methods
- Automatic level validation - excludes breached levels in real-time
- Smart level clustering - merges nearby levels based on ATR/Fixed %/Range
- Zigzag visualization for trend structure analysis
- Automatic Fibonacci retracement levels on last swing (0.236, 0.382, 0.500, 0.618, 0.786)
- Pending pivots detection - shows forming levels before full confirmation
- Configurable sensitivity (Dynamic ATR / Fixed % / Range-based)
- Real-time breakout alerts for resistance and support
- Clean visual design with price labels and customizable colors
HOW IT WORKS:
The indicator identifies pivot highs/lows using candle bodies instead of wicks, providing more significant
price levels. Only unbreached levels are displayed. A zigzag connects confirmed pivots to show market structure.
Fibonacci retracement levels are automatically drawn on the last complete swing when it exceeds the minimum size threshold.
BEST USE:
Works on all timeframes and asset classes. Recommended for DAILY timeframes and higher for swing trading
to identify major support/resistance zones and key retracement levels. Lower timeframes suitable for intraday scalping.
릴리즈 노트
TRI - SUPPORT/RESISTANCE ZONES v1.6.0DESCRIPTION:
Advanced support and resistance indicator with body-based pivot detection, zigzag visualization,
and automatic Fibonacci retracement levels. Designed for precise technical analysis across all timeframes.
KEY FEATURES:
- Body-based pivot detection (open/close) for more reliable levels vs traditional wick-based methods
- Automatic level validation - excludes breached levels in real-time
- Smart level clustering - merges nearby levels based on ATR/Fixed %/Range
- Zigzag visualization for trend structure analysis
- Automatic Fibonacci retracement on latest directional swing (0.236, 0.382, 0.500, 0.618, 0.786)
- Visual swing highlight - yellow box shows the swing used for Fibonacci calculation
- Lateral market filter - skips small swings to focus on directional moves
- Pending pivots detection - shows forming levels before full confirmation
- Configurable sensitivity (Dynamic ATR / Fixed % / Range-based)
- Real-time breakout alerts for resistance and support
- Clean visual design with price labels and customizable colors
HOW IT WORKS:
The indicator identifies pivot highs/lows using candle bodies instead of wicks, providing more significant
price levels. Only unbreached levels are displayed. A zigzag connects confirmed pivots to show market structure.
Fibonacci retracement levels are automatically drawn on the most recent directional swing (high-to-low or low-to-high)
that exceeds the minimum size threshold, filtering out lateral market movements.
BEST USE:
Works on all timeframes and asset classes. Recommended for DAILY timeframes and higher for swing trading
to identify major support/resistance zones and key retracement levels. Lower timeframes suitable for intraday scalping.
릴리즈 노트
TRI - SUPPORT/RESISTANCE ZONES v1.6.1DESCRIPTION:
Advanced support and resistance indicator with body-based pivot detection, zigzag visualization,
and automatic Fibonacci retracement levels. Designed for precise technical analysis across all timeframes.
KEY FEATURES:
- Body-based pivot detection (open/close) for more reliable levels vs traditional wick-based methods
- Automatic level validation - excludes breached levels in real-time
- Smart level clustering - merges nearby levels based on ATR/Fixed %/Range
- Zigzag visualization for trend structure analysis
- Automatic Fibonacci retracement on latest directional swing (0.236, 0.382, 0.500, 0.618, 0.786)
- Visual swing highlight - yellow box shows the swing used for Fibonacci calculation
- Lateral market filter - skips small swings to focus on directional moves
- Pending pivots detection - shows forming levels before full confirmation
- Configurable sensitivity (Dynamic ATR / Fixed % / Range-based)
- Real-time breakout alerts for resistance and support
- Clean visual design with price labels and customizable colors
HOW IT WORKS:
The indicator identifies pivot highs/lows using candle bodies instead of wicks, providing more significant
price levels. Only unbreached levels are displayed. A zigzag connects confirmed pivots to show market structure.
Fibonacci retracement levels are automatically drawn on the most recent directional swing (high-to-low or low-to-high)
that exceeds the minimum size threshold, filtering out lateral market movements.
BEST USE:
Works on all timeframes and asset classes. Recommended for DAILY timeframes and higher for swing trading
to identify major support/resistance zones and key retracement levels. Lower timeframes suitable for intraday scalping.
릴리즈 노트
TRI - SUPPORT/RESISTANCE ZONES v1.8.0DESCRIPTION:
Advanced support and resistance indicator with body-based pivot detection, zigzag visualization,
and automatic Fibonacci retracement levels. Designed for precise technical analysis across all timeframes.
KEY FEATURES:
- Body-based pivot detection (open/close) for more reliable levels vs traditional wick-based methods
- Automatic level validation - excludes breached levels in real-time
- Mitigated level tracking - shows recently breached levels for N bars with distinct styling
- Smart level clustering - merges nearby levels based on ATR/Fixed %/Range
- Zigzag visualization for trend structure analysis
- Automatic Fibonacci retracement on latest directional swing (0.236, 0.382, 0.500, 0.618, 0.786)
- Visual swing highlight - yellow box shows the swing used for Fibonacci calculation
- Lateral market filter - skips small swings to focus on directional moves
- Pending pivots detection - shows forming levels before full confirmation
- Configurable sensitivity (Dynamic ATR / Fixed % / Range-based)
- Real-time breakout alerts for resistance and support
- Clean visual design with price labels and customizable colors
HOW IT WORKS:
The indicator identifies pivot highs/lows using candle bodies instead of wicks, providing more significant
price levels. Only unbreached levels are displayed as active support/resistance. When a level is breached,
it becomes a "mitigated level" and is displayed for N bars with distinct styling (orange dashed line) to
help traders track recently broken levels. The algorithm walks backwards from the current bar to find the
most recently mitigated level, ensuring only the latest breach is shown.
A zigzag connects confirmed pivots to show market structure. Fibonacci retracement levels are automatically
drawn on the most recent directional swing (high-to-low or low-to-high) that exceeds the minimum size
threshold, filtering out lateral market movements.
BEST USE:
Works on all timeframes and asset classes. Recommended for DAILY timeframes and higher for swing trading
to identify major support/resistance zones, key retracement levels, and recently mitigated areas.
Mitigated levels help identify potential re-test zones or areas where market structure has changed.
Lower timeframes suitable for intraday scalping.
릴리즈 노트
TRI - SUPPORT/RESISTANCE ZONES v1.8.1DESCRIPTION:
Advanced support and resistance indicator with body-based pivot detection, zigzag visualization,
and automatic Fibonacci retracement levels. Designed for precise technical analysis across all timeframes.
KEY FEATURES:
- Body-based pivot detection (open/close) for more reliable levels vs traditional wick-based methods
- Automatic level validation - excludes breached levels in real-time
- Mitigated level tracking - shows recently breached levels for N bars with distinct styling
- Smart level clustering - merges nearby levels based on ATR/Fixed %/Range
- Zigzag visualization for trend structure analysis
- Automatic Fibonacci retracement on latest directional swing (0.236, 0.382, 0.500, 0.618, 0.786)
- Visual swing highlight - yellow box shows the swing used for Fibonacci calculation
- Lateral market filter - skips small swings to focus on directional moves
- Pending pivots detection - shows forming levels before full confirmation
- Configurable sensitivity (Dynamic ATR / Fixed % / Range-based)
- Real-time breakout alerts for resistance and support
- Clean visual design with price labels and customizable colors
HOW IT WORKS:
The indicator identifies pivot highs/lows using candle bodies instead of wicks, providing more significant
price levels. Only unbreached levels are displayed as active support/resistance. When a level is breached,
it becomes a "mitigated level" and is displayed for N bars with distinct styling (orange dashed line) to
help traders track recently broken levels. The algorithm walks backwards from the current bar to find the
most recently mitigated level, ensuring only the latest breach is shown.
A zigzag connects confirmed pivots to show market structure. Fibonacci retracement levels are automatically
drawn on the most recent directional swing (high-to-low or low-to-high) that exceeds the minimum size
threshold, filtering out lateral market movements.
BEST USE:
Works on all timeframes and asset classes. Recommended for DAILY timeframes and higher for swing trading
to identify major support/resistance zones, key retracement levels, and recently mitigated areas.
Mitigated levels help identify potential re-test zones or areas where market structure has changed.
Lower timeframes suitable for intraday scalping.
릴리즈 노트
TRI - SUPPORT/RESISTANCE ZONES v1.10.0DESCRIPTION:
Advanced support and resistance indicator with body-based pivot detection, zigzag visualization,
Fair Value Gaps, and automatic Fibonacci retracement levels. Designed for precise technical analysis
across all timeframes.
KEY FEATURES:
- Flexible pivot detection - choose between Body (open/close) or Wick (high/low) methods
- Fair Value Gaps (FVG) detection with customizable threshold and visualization
- Automatic level validation - excludes breached levels in real-time
- Mitigated level tracking - shows recently breached levels for N bars with distinct styling
- Smart level clustering - merges nearby levels based on ATR/Fixed %/Range
- Zigzag visualization for trend structure analysis
- Automatic Fibonacci retracement on latest directional swing (0.236, 0.382, 0.500, 0.618, 0.786)
- Visual swing highlight - yellow box shows the swing used for Fibonacci calculation
- Lateral market filter - skips small swings to focus on directional moves
- Pending pivots detection - shows forming levels before full confirmation
- Configurable sensitivity (Dynamic ATR / Fixed % / Range-based)
- Real-time breakout alerts for resistance and support
- Clean visual design with price labels and customizable colors
HOW IT WORKS:
The indicator identifies pivot highs/lows with selectable detection mode: Body mode uses open/close for more
reliable levels that reflect true price acceptance, while Wick mode uses traditional high/low for classic pivot
analysis. Only unbreached levels are displayed as active support/resistance. When a level is breached, it becomes
a "mitigated level" and is displayed for N bars with distinct styling (orange dashed line) to help traders track
recently broken levels. The algorithm walks backwards from the current bar to find the most recently mitigated
level, ensuring only the latest breach is shown.
Fair Value Gaps (FVG): Detected when there's a 3-candle pattern with a gap between candle 1 and candle 3,
indicating institutional order flow imbalances. Bullish FVG occurs when candle 3's low is above candle 1's high
(gap up), creating a demand zone shown in green. Bearish FVG occurs when candle 3's high is below candle 1's low
(gap down), creating a supply zone shown in red. FVG zones remain active until price closes through them
(mitigation), then automatically disappear. These gaps often act as support/resistance and are frequently filled
by price returning to rebalance the imbalance.
A zigzag connects confirmed pivots to show market structure. Fibonacci retracement levels are automatically
drawn on the most recent directional swing (high-to-low or low-to-high) that exceeds the minimum size
threshold, filtering out lateral market movements.
BEST USE:
Works on all timeframes and asset classes. Recommended for DAILY timeframes and higher for swing trading
to identify major support/resistance zones, Fair Value Gaps, key retracement levels, and recently mitigated
areas. FVG zones are particularly useful for identifying potential entry/exit points and institutional order
flow imbalances. Mitigated levels help identify potential re-test zones or areas where market structure has
changed. Lower timeframes suitable for intraday scalping.
릴리즈 노트
TRI - SUPPORT/RESISTANCE ZONES v1.14.0DESCRIPTION:
Advanced support and resistance indicator with body-based pivot detection, Fair Value Gaps,
intelligent Fibonacci projection, and comprehensive alert system. Designed for precise technical
analysis across all timeframes with real-time and confirmed alerts.
KEY FEATURES:
- Flexible pivot detection - choose between Body (open/close) or Wick (high/low) methods
- Fair Value Gaps (FVG) detection with customizable threshold and visualization
- Automatic level validation - excludes breached levels in real-time
- Mitigated level tracking - shows recently breached levels until new level is created
- Smart Fibonacci projection - adapts based on mitigated levels and price position
- Smart level clustering - merges nearby levels based on ATR/Fixed %/Range
- Pending pivots detection - shows forming levels before full confirmation
- Configurable sensitivity (Dynamic ATR / Fixed % / Range-based)
- Comprehensive alert system - real-time and confirmed breakouts, level creation, FVG events
- Debug mode with visual labels - see exactly where each alert triggers
- Clean visual design with price labels and customizable colors
HOW IT WORKS:
The indicator identifies pivot highs/lows with selectable detection mode: Body mode uses open/close for more
reliable levels that reflect true price acceptance, while Wick mode uses traditional high/low for classic pivot
analysis. Only unbreached levels are displayed as active support/resistance. When a level is breached, it becomes
a "mitigated level" and is displayed with distinct styling (orange dashed line) until a new level of the same type
is created, helping traders track recently broken levels. The algorithm walks backwards from the current bar to
find the most recently mitigated level, ensuring only the latest breach is shown.
Fair Value Gaps (FVG): Detected when there's a 3-candle pattern with a gap between candle 1 and candle 3,
indicating institutional order flow imbalances. Bullish FVG occurs when candle 3's low is above candle 1's high
(gap up), creating a demand zone shown in green. Bearish FVG occurs when candle 3's high is below candle 1's low
(gap down), creating a supply zone shown in red. FVG zones remain active until price closes through them
(mitigation), then automatically disappear. These gaps often act as support/resistance and are frequently filled
by price returning to rebalance the imbalance.
INTELLIGENT FIBONACCI: The indicator automatically calculates Fibonacci levels based on key support/resistance
levels with intelligent mode selection. If a mitigated (orange) level exists, it uses that level and its opposite
(resistance + support pair). If no mitigated level exists, it uses the most recent support and resistance levels.
When price is BETWEEN the two levels, Fibonacci Retracement levels (0.236, 0.382, 0.500, 0.618, 0.786) are displayed
in blue. When price moves OUTSIDE the range (with a mitigated level present), Fibonacci Extension levels (1.272, 1.618,
2.000, 2.618) are shown in purple, providing dynamic targets for price continuation or reversal.
ALERT SYSTEM: The indicator provides 12 different alert types:
- Resistance Breakout (real-time) - triggers when price closes above resistance
- Support Breakdown (real-time) - triggers when price closes below support
- Resistance Breakout CONFIRMED - triggers on the bar AFTER a breakout candle closes
- Support Breakdown CONFIRMED - triggers on the bar AFTER a breakdown candle closes
- New Resistance Level - triggers when a new resistance level is created
- New Support Level - triggers when a new support level is created
- Bullish FVG Created - triggers when a bullish fair value gap is detected
- Bearish FVG Created - triggers when a bearish fair value gap is detected
- Bullish FVG Mitigated - triggers when price closes through a bullish FVG
- Bearish FVG Mitigated - triggers when price closes through a bearish FVG
Real-time alerts fire immediately when the event occurs. Confirmed alerts wait for the next bar,
ensuring the breakout candle has fully closed. Enable "Show Alert Labels" in Debug settings to
visualize exactly where each alert triggers on the chart.
BEST USE:
Works on all timeframes and asset classes. Recommended for DAILY timeframes and higher for swing trading
to identify major support/resistance zones, Fair Value Gaps, Fibonacci targets, and recently mitigated areas.
FVG zones are particularly useful for identifying potential entry/exit points and institutional order flow
imbalances. Mitigated levels help identify potential re-test zones or areas where market structure has changed.
Fibonacci levels provide precise targets for entries, exits, and stop-loss placement. Lower timeframes suitable
for intraday scalping.
오픈 소스 스크립트
트레이딩뷰의 진정한 정신에 따라, 이 스크립트의 작성자는 이를 오픈소스로 공개하여 트레이더들이 기능을 검토하고 검증할 수 있도록 했습니다. 작성자에게 찬사를 보냅니다! 이 코드는 무료로 사용할 수 있지만, 코드를 재게시하는 경우 하우스 룰이 적용된다는 점을 기억하세요.
면책사항
해당 정보와 게시물은 금융, 투자, 트레이딩 또는 기타 유형의 조언이나 권장 사항으로 간주되지 않으며, 트레이딩뷰에서 제공하거나 보증하는 것이 아닙니다. 자세한 내용은 이용 약관을 참조하세요.
오픈 소스 스크립트
트레이딩뷰의 진정한 정신에 따라, 이 스크립트의 작성자는 이를 오픈소스로 공개하여 트레이더들이 기능을 검토하고 검증할 수 있도록 했습니다. 작성자에게 찬사를 보냅니다! 이 코드는 무료로 사용할 수 있지만, 코드를 재게시하는 경우 하우스 룰이 적용된다는 점을 기억하세요.
면책사항
해당 정보와 게시물은 금융, 투자, 트레이딩 또는 기타 유형의 조언이나 권장 사항으로 간주되지 않으며, 트레이딩뷰에서 제공하거나 보증하는 것이 아닙니다. 자세한 내용은 이용 약관을 참조하세요.