OPEN-SOURCE SCRIPT
Delimited Levels
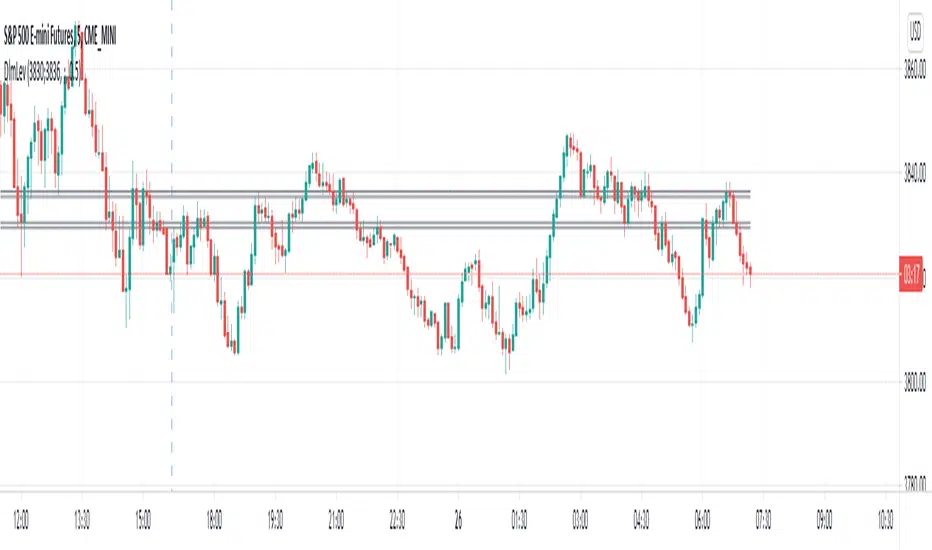
This script takes a delimited string of level values (up to 12) and plots them on the chart as per parameters.
Alerts can be set up for crossing, etc, using the Alerts panel as per usual.
Very handy if you have a spreadsheet or list of values to plot.
For example, say your spreadsheet has a list of these 12 levels to plot:
3800
3811
3822
3837
3851
3862
3877
3887
3902
3913
3928
The values could be copied to notepad / text editor, and the line breaks replaced with a delimiter, such as the ';' character (note: no trailing delimiter), to produce a delimited string:
3800;3811;3822;3837;3851;3862;3877;3887;3902;3913;3928
And then simply copy / paste this delimited string into the "Levels Delimited String" parameter.
오픈 소스 스크립트
트레이딩뷰의 진정한 정신에 따라, 이 스크립트의 작성자는 이를 오픈소스로 공개하여 트레이더들이 기능을 검토하고 검증할 수 있도록 했습니다. 작성자에게 찬사를 보냅니다! 이 코드는 무료로 사용할 수 있지만, 코드를 재게시하는 경우 하우스 룰이 적용된다는 점을 기억하세요.
면책사항
해당 정보와 게시물은 금융, 투자, 트레이딩 또는 기타 유형의 조언이나 권장 사항으로 간주되지 않으며, 트레이딩뷰에서 제공하거나 보증하는 것이 아닙니다. 자세한 내용은 이용 약관을 참조하세요.
오픈 소스 스크립트
트레이딩뷰의 진정한 정신에 따라, 이 스크립트의 작성자는 이를 오픈소스로 공개하여 트레이더들이 기능을 검토하고 검증할 수 있도록 했습니다. 작성자에게 찬사를 보냅니다! 이 코드는 무료로 사용할 수 있지만, 코드를 재게시하는 경우 하우스 룰이 적용된다는 점을 기억하세요.
면책사항
해당 정보와 게시물은 금융, 투자, 트레이딩 또는 기타 유형의 조언이나 권장 사항으로 간주되지 않으며, 트레이딩뷰에서 제공하거나 보증하는 것이 아닙니다. 자세한 내용은 이용 약관을 참조하세요.