OPEN-SOURCE SCRIPT
업데이트됨 Table Identifies the Price Extensively Using RSI, MA, and ATR
⬤ INDICATOR KEY

⬤ INTRODUCTION
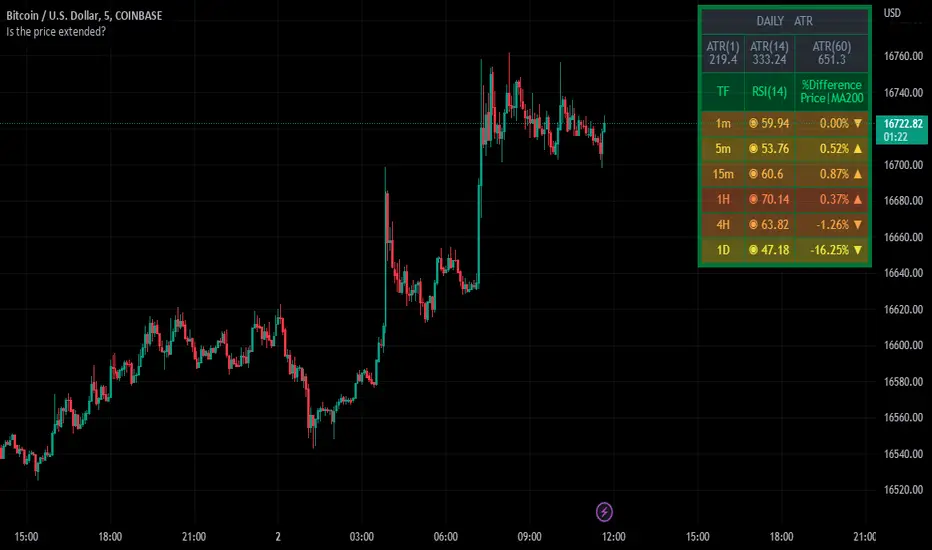
The indicator has presented as a table to show the perspective result of different indicators to help the user identify the status of the price if it’s extended or not. The table starts with the ATR section, which gives out a better look to compare the current day’s candle wide versus the average candle wide of a certain length of period that selected by the user. The second section of the table, showing RSI values at the most common upper timeframes, and the different percentages between the current price and long-term moving average entered by the user.
⬤ INDICATOR OVERVIEW

⬤ FINAL COMMENTS
▸This’s not a trading signal, but it helps to make a trading decision whether to set targets, stop loss, and enter a new trade.
▸If you found this content useful, please consider supporting presented indicators projects through PayPal which mentioned in the signature box, below.
▸ Trade Safe✌️.
⬤ OTHER GREAT INDICATORS CREATED BY MUQWISHI
📈 Muqwishi Volumetric Candle
📈 Support and Resistance For Day Trader | By MUQWISHI
⬤ INTRODUCTION
The indicator has presented as a table to show the perspective result of different indicators to help the user identify the status of the price if it’s extended or not. The table starts with the ATR section, which gives out a better look to compare the current day’s candle wide versus the average candle wide of a certain length of period that selected by the user. The second section of the table, showing RSI values at the most common upper timeframes, and the different percentages between the current price and long-term moving average entered by the user.
⬤ INDICATOR OVERVIEW
⬤ FINAL COMMENTS
▸This’s not a trading signal, but it helps to make a trading decision whether to set targets, stop loss, and enter a new trade.
▸If you found this content useful, please consider supporting presented indicators projects through PayPal which mentioned in the signature box, below.
▸ Trade Safe✌️.
⬤ OTHER GREAT INDICATORS CREATED BY MUQWISHI
📈 Muqwishi Volumetric Candle
📈 Support and Resistance For Day Trader | By MUQWISHI
릴리즈 노트
Table Identifies the Price Extensively Using RSI, MA, and ATR V2▮ Version 2, Updates:
1- Improved Code.
2- Made it works on a pre-market session.
3- Improved colors options.
4- User can custom timeframes.
5- It'll show all timeframes.
오픈 소스 스크립트
트레이딩뷰의 진정한 정신에 따라, 이 스크립트의 작성자는 이를 오픈소스로 공개하여 트레이더들이 기능을 검토하고 검증할 수 있도록 했습니다. 작성자에게 찬사를 보냅니다! 이 코드는 무료로 사용할 수 있지만, 코드를 재게시하는 경우 하우스 룰이 적용된다는 점을 기억하세요.
Trusted Pine Programmer, For Coding Inquiries
► Website muqwishi.com/home/quotation/
► Telegram t.me/MUQWISHI
► Email service@muqwishi.com
⛾ Support My Work on “Buy Me a Coffee” buymeacoffee.com/muqwishi
► Website muqwishi.com/home/quotation/
► Telegram t.me/MUQWISHI
► Email service@muqwishi.com
⛾ Support My Work on “Buy Me a Coffee” buymeacoffee.com/muqwishi
면책사항
해당 정보와 게시물은 금융, 투자, 트레이딩 또는 기타 유형의 조언이나 권장 사항으로 간주되지 않으며, 트레이딩뷰에서 제공하거나 보증하는 것이 아닙니다. 자세한 내용은 이용 약관을 참조하세요.