OPEN-SOURCE SCRIPT
Green Line Breakout (GLB) - Public Use
NOTE: This is public use - open source version of GLB published by me in Sep 2020. As Trading View is not allow unprotect script already shared, I am sharing it for anyone to use the script and make a copy.
========
This is an implementation of Green Line Breakout ( GLB ) which is popularized by Eric Wish through his Wishing Wealth Blog.
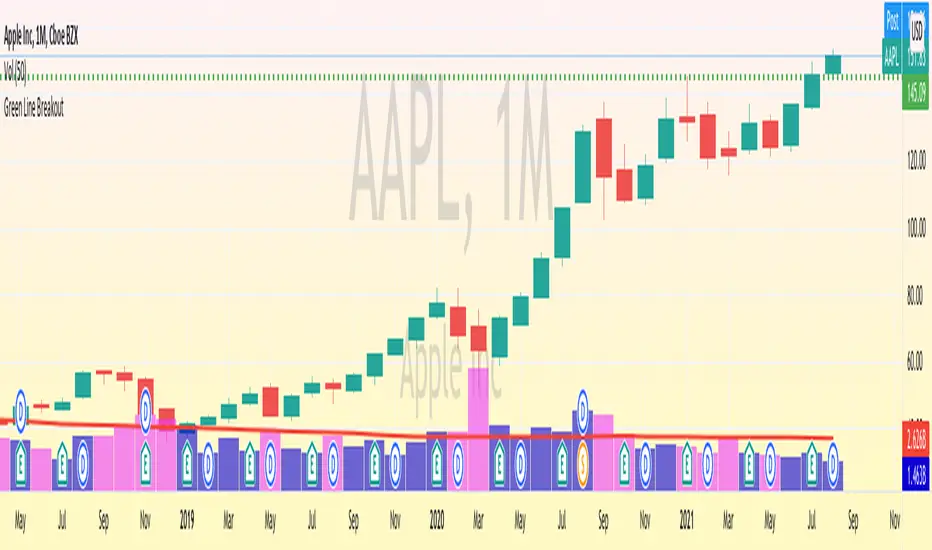
GLB indicator looks at a monthly chart for a stock that hit a new all time high recently and draw a green horizontal line at the highest price reached at any month, that has not been surpassed for at least 3 months.
In other words, this method finds stock that reached an all-time high and has then rested for at least three months. When a stock moves through the green line or is above its last green line, it is an indication of strong buying interest.
Read more about how to use the indicator in Wishing Wealth Blog.
Usage Explanation:
1. Set the time frame to Monthly for a stock and automatically a green dashed line appears based on the calculation explained above
2. If no GLB found for a stock, then green line appears at 0.0
2. If you set any other time frame other than Monthly, no Green Dashed line shown
========
This is an implementation of Green Line Breakout ( GLB ) which is popularized by Eric Wish through his Wishing Wealth Blog.
GLB indicator looks at a monthly chart for a stock that hit a new all time high recently and draw a green horizontal line at the highest price reached at any month, that has not been surpassed for at least 3 months.
In other words, this method finds stock that reached an all-time high and has then rested for at least three months. When a stock moves through the green line or is above its last green line, it is an indication of strong buying interest.
Read more about how to use the indicator in Wishing Wealth Blog.
Usage Explanation:
1. Set the time frame to Monthly for a stock and automatically a green dashed line appears based on the calculation explained above
2. If no GLB found for a stock, then green line appears at 0.0
2. If you set any other time frame other than Monthly, no Green Dashed line shown
오픈 소스 스크립트
트레이딩뷰의 진정한 정신에 따라, 이 스크립트의 작성자는 이를 오픈소스로 공개하여 트레이더들이 기능을 검토하고 검증할 수 있도록 했습니다. 작성자에게 찬사를 보냅니다! 이 코드는 무료로 사용할 수 있지만, 코드를 재게시하는 경우 하우스 룰이 적용된다는 점을 기억하세요.
면책사항
해당 정보와 게시물은 금융, 투자, 트레이딩 또는 기타 유형의 조언이나 권장 사항으로 간주되지 않으며, 트레이딩뷰에서 제공하거나 보증하는 것이 아닙니다. 자세한 내용은 이용 약관을 참조하세요.
오픈 소스 스크립트
트레이딩뷰의 진정한 정신에 따라, 이 스크립트의 작성자는 이를 오픈소스로 공개하여 트레이더들이 기능을 검토하고 검증할 수 있도록 했습니다. 작성자에게 찬사를 보냅니다! 이 코드는 무료로 사용할 수 있지만, 코드를 재게시하는 경우 하우스 룰이 적용된다는 점을 기억하세요.
면책사항
해당 정보와 게시물은 금융, 투자, 트레이딩 또는 기타 유형의 조언이나 권장 사항으로 간주되지 않으며, 트레이딩뷰에서 제공하거나 보증하는 것이 아닙니다. 자세한 내용은 이용 약관을 참조하세요.