INVITE-ONLY SCRIPT
Mayfair Advanced Regressions 1.0

This indicator maps two regressions.
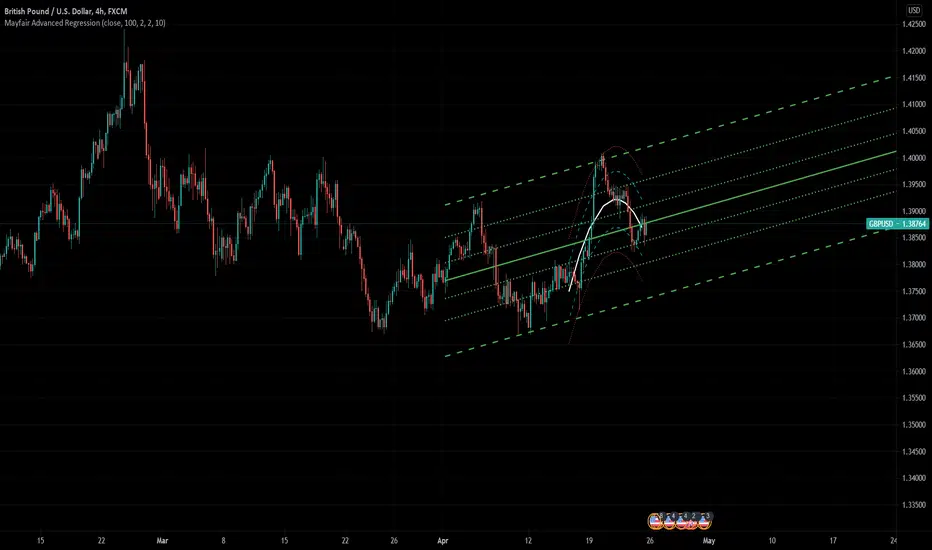
The outer regression (green straight lines in the chart) tracks the main trend. It save you from working out your own trend channels, BUT it does move with the price, so it is different from a static channel. You can use it as a template for drawing static channels though.
The inner regression (the curved lines) is a parabolic regression. It shows the shorter term trend within the outer trend. This helps traders to judge when it is right or wrong to take a position on the edge of the main regression, based on whether the inner regression is indicating an acceleration out of the channel, or is shaping to go with the main trend.
We find it works best if there is a clear trend. If the market is not trending, then there isn't much point using a trend analysis tool like this.
Like all indicators, it is not perfect, and you should never rely on one indicator in any situation.
초대 전용 스크립트
이 스크립트는 작성자가 승인한 사용자만 접근할 수 있습니다. 사용하려면 요청 후 승인을 받아야 하며, 일반적으로 결제 후에 허가가 부여됩니다. 자세한 내용은 아래 작성자의 안내를 따르거나 Paul_Varcoe에게 직접 문의하세요.
트레이딩뷰는 스크립트의 작동 방식을 충분히 이해하고 작성자를 완전히 신뢰하지 않는 이상, 해당 스크립트에 비용을 지불하거나 사용하는 것을 권장하지 않습니다. 커뮤니티 스크립트에서 무료 오픈소스 대안을 찾아보실 수도 있습니다.
작성자 지시 사항
To buy this script, please go here: https://launchpass.com/mayfair-trading-and-mentoring/regressions
eBook ON SURVIVAL: amazon.co.uk/dp/B0BSY763W3
THE CITY TRADERS: thecitytraders.com/?aff=9
Discord: discord.gg/Ma7SnExcWA
THE CITY TRADERS: thecitytraders.com/?aff=9
Discord: discord.gg/Ma7SnExcWA
면책사항
해당 정보와 게시물은 금융, 투자, 트레이딩 또는 기타 유형의 조언이나 권장 사항으로 간주되지 않으며, 트레이딩뷰에서 제공하거나 보증하는 것이 아닙니다. 자세한 내용은 이용 약관을 참조하세요.