OPEN-SOURCE SCRIPT
업데이트됨 Renko Chart Emulation
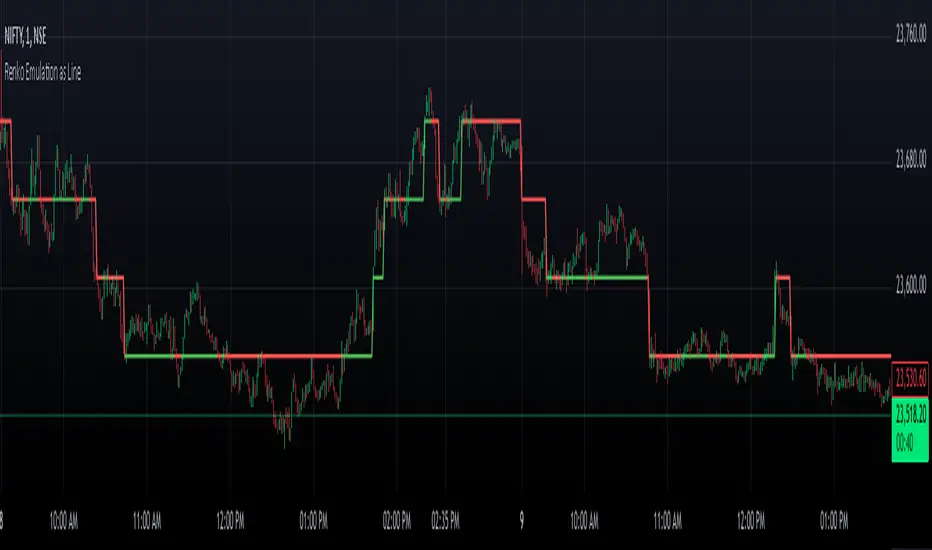
Renko charts are a popular tool in technical analysis, known for their ability to filter out market noise and focus purely on price movements. Unlike traditional candlestick or bar charts, Renko charts are not time-based but are constructed using bricks that represent a fixed price movement. This makes them particularly useful for identifying trends and key levels of support and resistance. While Renko charts are commonly found on platforms with specialized charting capabilities, they can also be emulated in Pine Script as a line indicator.
The Renko emulation indicator in Pine Script calculates the movement of price based on a user-defined brick size. Whenever the price moves up or down by an amount equal to or greater than the brick size, a new level is plotted, indicating a shift in price direction. This approach helps traders visualize significant price moves without the distractions of smaller fluctuations. By plotting the Renko levels as a continuous line and coloring it based on direction, this indicator provides a clean and straightforward representation of market trends.
Traders can use this Renko emulation line to identify potential entry and exit points, as well as to confirm ongoing trends. The simplicity of Renko charts makes them a favorite among those who prefer a minimalist approach to technical analysis. However, it is essential to choose an appropriate brick size that aligns with the volatility of the trading instrument. A smaller brick size may result in frequent signals, while a larger one can smooth out the chart, focusing only on the most substantial price movements. This script offers a flexible solution for incorporating Renko-style analysis into any trading strategy.
릴리즈 노트
Overlay fixed오픈 소스 스크립트
트레이딩뷰의 진정한 정신에 따라, 이 스크립트의 작성자는 이를 오픈소스로 공개하여 트레이더들이 기능을 검토하고 검증할 수 있도록 했습니다. 작성자에게 찬사를 보냅니다! 이 코드는 무료로 사용할 수 있지만, 코드를 재게시하는 경우 하우스 룰이 적용된다는 점을 기억하세요.
면책사항
해당 정보와 게시물은 금융, 투자, 트레이딩 또는 기타 유형의 조언이나 권장 사항으로 간주되지 않으며, 트레이딩뷰에서 제공하거나 보증하는 것이 아닙니다. 자세한 내용은 이용 약관을 참조하세요.
오픈 소스 스크립트
트레이딩뷰의 진정한 정신에 따라, 이 스크립트의 작성자는 이를 오픈소스로 공개하여 트레이더들이 기능을 검토하고 검증할 수 있도록 했습니다. 작성자에게 찬사를 보냅니다! 이 코드는 무료로 사용할 수 있지만, 코드를 재게시하는 경우 하우스 룰이 적용된다는 점을 기억하세요.
면책사항
해당 정보와 게시물은 금융, 투자, 트레이딩 또는 기타 유형의 조언이나 권장 사항으로 간주되지 않으며, 트레이딩뷰에서 제공하거나 보증하는 것이 아닙니다. 자세한 내용은 이용 약관을 참조하세요.