INVITE-ONLY SCRIPT
업데이트됨 Mayfair Volume Stochastic 1.0
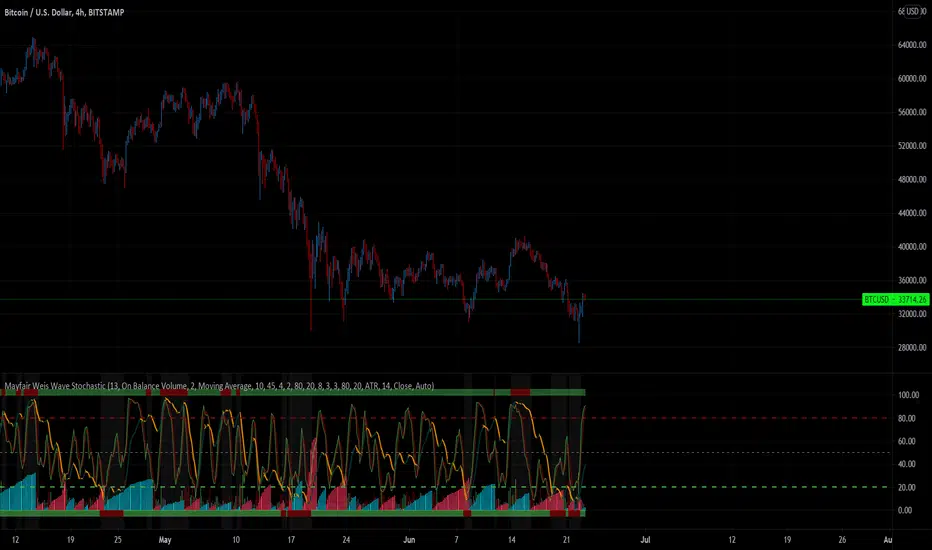
This indicator takes some of the simple tools such as RSI and Stochastic, and provides information of the macro picture for both trending and non-trending markets;
The Relative Strength Index part of the indicator is standard and is used in technical analysis that ranges between zero and one (or zero and 100 on some charting platforms.
This indicator has the ability to change between multiple settings; Elders Force Index, Money Flow Index, On Balance Volume & Price Volume Trend.
The Stochastic part is measuring not only the conventional Stochastic K – but also the accumulation/distribution and this is used with the volume bars at the bottom.
All are uniquely combined to give “False bar” signals when certain criteria is met – this is visualised by the Green turning Red on the upper and lower boundaries of the indicator. When Red, the trend is false, when green the trend is trending.
It’s a unique view of the market, confirmation of trend (false or not) inclusive of the volume profile across the bottom. Colour set to Red (Bearish), Green (Bullish) and Grey is undecisive volume.
릴리즈 노트
This version adds a Weis Wave function. users can choose between Volume and Price displays by switching the setting Renko Assignment method from ATR to Traditional.You can also switch the standard volume deviation and the Weis Wave displays on and off to de-clutter the display.
릴리즈 노트
Removed drawings on chart.릴리즈 노트
The link was wrong, so updated초대 전용 스크립트
이 스크립트는 작성자가 승인한 사용자만 접근할 수 있습니다. 사용하려면 요청 후 승인을 받아야 하며, 일반적으로 결제 후에 허가가 부여됩니다. 자세한 내용은 아래 작성자의 안내를 따르거나 Paul_Varcoe에게 직접 문의하세요.
트레이딩뷰는 스크립트의 작동 방식을 충분히 이해하고 작성자를 완전히 신뢰하지 않는 이상, 해당 스크립트에 비용을 지불하거나 사용하는 것을 권장하지 않습니다. 커뮤니티 스크립트에서 무료 오픈소스 대안을 찾아보실 수도 있습니다.
작성자 지시 사항
To buy this indicator, please click here: https://launchpass.com/mayfair-trading-and-mentoring/stochastic. The link contains a video explaining the indicator in even more detail.
eBook ON SURVIVAL: amazon.co.uk/dp/B0BSY763W3
THE CITY TRADERS: thecitytraders.com/?aff=9
Discord: discord.gg/Ma7SnExcWA
THE CITY TRADERS: thecitytraders.com/?aff=9
Discord: discord.gg/Ma7SnExcWA
면책사항
해당 정보와 게시물은 금융, 투자, 트레이딩 또는 기타 유형의 조언이나 권장 사항으로 간주되지 않으며, 트레이딩뷰에서 제공하거나 보증하는 것이 아닙니다. 자세한 내용은 이용 약관을 참조하세요.
초대 전용 스크립트
이 스크립트는 작성자가 승인한 사용자만 접근할 수 있습니다. 사용하려면 요청 후 승인을 받아야 하며, 일반적으로 결제 후에 허가가 부여됩니다. 자세한 내용은 아래 작성자의 안내를 따르거나 Paul_Varcoe에게 직접 문의하세요.
트레이딩뷰는 스크립트의 작동 방식을 충분히 이해하고 작성자를 완전히 신뢰하지 않는 이상, 해당 스크립트에 비용을 지불하거나 사용하는 것을 권장하지 않습니다. 커뮤니티 스크립트에서 무료 오픈소스 대안을 찾아보실 수도 있습니다.
작성자 지시 사항
To buy this indicator, please click here: https://launchpass.com/mayfair-trading-and-mentoring/stochastic. The link contains a video explaining the indicator in even more detail.
eBook ON SURVIVAL: amazon.co.uk/dp/B0BSY763W3
THE CITY TRADERS: thecitytraders.com/?aff=9
Discord: discord.gg/Ma7SnExcWA
THE CITY TRADERS: thecitytraders.com/?aff=9
Discord: discord.gg/Ma7SnExcWA
면책사항
해당 정보와 게시물은 금융, 투자, 트레이딩 또는 기타 유형의 조언이나 권장 사항으로 간주되지 않으며, 트레이딩뷰에서 제공하거나 보증하는 것이 아닙니다. 자세한 내용은 이용 약관을 참조하세요.