OPEN-SOURCE SCRIPT
EV Calculator [CHE]
EV Calculator [CHE] with Adjustable Boxes and Custom Colors for TradingView
Introduction:
As a trader, one of the key metrics you need to evaluate is the Expected Value (EV) of your trading strategy. Understanding EV helps you gauge whether your trades will be profitable in the long run. This TradingView script allows you to visualize your EV alongside customizable win rates and risk-to-reward ratios. With adjustable visual components, you can quickly determine whether your trading strategy has a positive or negative EV, and make informed decisions.
Features of the Script:
1. Customizable Inputs:
- Win Rate: Set your win probability (0.0 to 1.0), which represents how often your strategy is successful.
- Risk and Reward: Define how much you're risking and the potential reward for each trade.
2. Visual Representation:
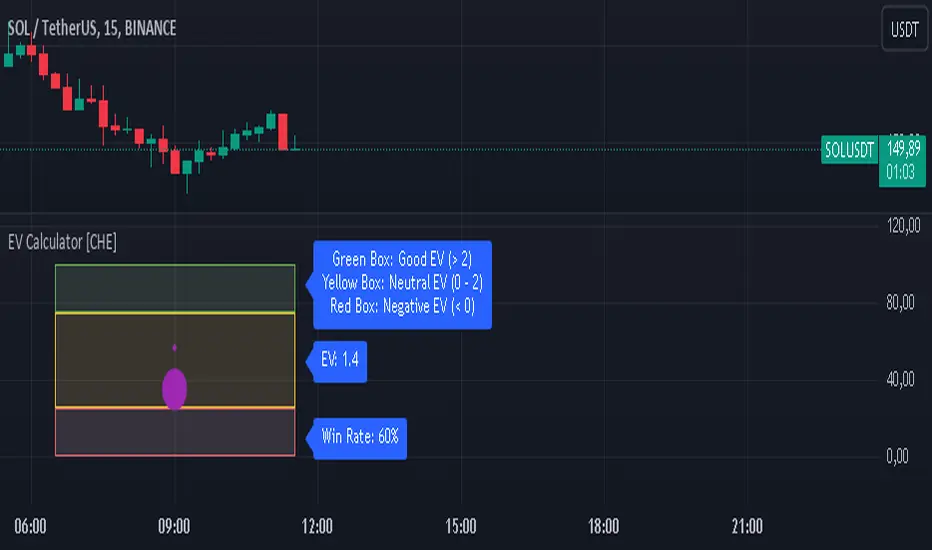
- The script creates colored boxes representing different EV scenarios:
- Green Box: Indicates a good EV (>2), suggesting a highly profitable strategy.
- Yellow Box: Represents a neutral EV (between 0 and 2), where the strategy could work but is not optimal.
- Red Box: Shows a negative EV (<0), signaling that the strategy may lead to losses.
3. Adjustable Box Size:
- You can modify the width and height of the boxes to fit your chart display preferences, giving you better visual clarity based on your screen or chart style.
4. Dynamic Labels:
- Each bar in the chart includes dynamic labels showing:
- Win Rate: Displays the percentage chance of success.
- EV Value: Shows the calculated expected value based on the win rate and risk-reward ratio.
- Guide: Explains what each colored box means so that you can easily interpret the chart.
5. Scalability and Flexibility:
- The script only keeps a maximum of 20 recent entries, ensuring that your chart stays clean and organized.
- Both the number of labels and boxes adjust automatically to match your preferred settings, enhancing usability.
How the EV Calculation Works:
The formula for EV is based on a standard risk-to-reward model:
EV = (Win\ Rate \times Reward) - (Loss\ Probability \times Risk)
For example:
- If your win rate is 60% and your risk-to-reward ratio is 1:3, the script will calculate whether this strategy is expected to yield positive returns or result in long-term losses.
Example Use Case:
Let's say you are trading with a 60% win rate, risking 1 unit to gain 3 units. The script calculates that your EV is positive and represents this with a Green Box, showing you that your strategy has a high likelihood of being profitable. If your strategy slips and the win rate drops, the EV calculation will adjust, and you may see Yellow or Red Boxes, signaling a need for adjustment.
Final Thoughts:
This script is designed for traders who want to take their analysis beyond the basics. By providing real-time visualization of your EV, you can better assess whether your strategy is sound and make adjustments as needed.
How to Use:
- Adjust the input parameters for Win Rate, Risk, and Reward to match your trading strategy.
- Observe the colored boxes and labels to quickly understand if your current strategy is in a healthy EV zone.
- Use this visual feedback to refine your approach and stay on track towards profitability.
This tool simplifies the complex calculations behind EV and turns it into an intuitive and powerful decision-making aid for traders.
Now you're ready to integrate the EV Calculator with Adjustable Boxes and Custom Colors into your trading routine and start optimizing your strategies for long-term success!
Happy Trading and best regards Chervolino
Introduction:
As a trader, one of the key metrics you need to evaluate is the Expected Value (EV) of your trading strategy. Understanding EV helps you gauge whether your trades will be profitable in the long run. This TradingView script allows you to visualize your EV alongside customizable win rates and risk-to-reward ratios. With adjustable visual components, you can quickly determine whether your trading strategy has a positive or negative EV, and make informed decisions.
Features of the Script:
1. Customizable Inputs:
- Win Rate: Set your win probability (0.0 to 1.0), which represents how often your strategy is successful.
- Risk and Reward: Define how much you're risking and the potential reward for each trade.
2. Visual Representation:
- The script creates colored boxes representing different EV scenarios:
- Green Box: Indicates a good EV (>2), suggesting a highly profitable strategy.
- Yellow Box: Represents a neutral EV (between 0 and 2), where the strategy could work but is not optimal.
- Red Box: Shows a negative EV (<0), signaling that the strategy may lead to losses.
3. Adjustable Box Size:
- You can modify the width and height of the boxes to fit your chart display preferences, giving you better visual clarity based on your screen or chart style.
4. Dynamic Labels:
- Each bar in the chart includes dynamic labels showing:
- Win Rate: Displays the percentage chance of success.
- EV Value: Shows the calculated expected value based on the win rate and risk-reward ratio.
- Guide: Explains what each colored box means so that you can easily interpret the chart.
5. Scalability and Flexibility:
- The script only keeps a maximum of 20 recent entries, ensuring that your chart stays clean and organized.
- Both the number of labels and boxes adjust automatically to match your preferred settings, enhancing usability.
How the EV Calculation Works:
The formula for EV is based on a standard risk-to-reward model:
EV = (Win\ Rate \times Reward) - (Loss\ Probability \times Risk)
For example:
- If your win rate is 60% and your risk-to-reward ratio is 1:3, the script will calculate whether this strategy is expected to yield positive returns or result in long-term losses.
Example Use Case:
Let's say you are trading with a 60% win rate, risking 1 unit to gain 3 units. The script calculates that your EV is positive and represents this with a Green Box, showing you that your strategy has a high likelihood of being profitable. If your strategy slips and the win rate drops, the EV calculation will adjust, and you may see Yellow or Red Boxes, signaling a need for adjustment.
Final Thoughts:
This script is designed for traders who want to take their analysis beyond the basics. By providing real-time visualization of your EV, you can better assess whether your strategy is sound and make adjustments as needed.
How to Use:
- Adjust the input parameters for Win Rate, Risk, and Reward to match your trading strategy.
- Observe the colored boxes and labels to quickly understand if your current strategy is in a healthy EV zone.
- Use this visual feedback to refine your approach and stay on track towards profitability.
This tool simplifies the complex calculations behind EV and turns it into an intuitive and powerful decision-making aid for traders.
Now you're ready to integrate the EV Calculator with Adjustable Boxes and Custom Colors into your trading routine and start optimizing your strategies for long-term success!
Happy Trading and best regards Chervolino
오픈 소스 스크립트
트레이딩뷰의 진정한 정신에 따라, 이 스크립트의 작성자는 이를 오픈소스로 공개하여 트레이더들이 기능을 검토하고 검증할 수 있도록 했습니다. 작성자에게 찬사를 보냅니다! 이 코드는 무료로 사용할 수 있지만, 코드를 재게시하는 경우 하우스 룰이 적용된다는 점을 기억하세요.
면책사항
해당 정보와 게시물은 금융, 투자, 트레이딩 또는 기타 유형의 조언이나 권장 사항으로 간주되지 않으며, 트레이딩뷰에서 제공하거나 보증하는 것이 아닙니다. 자세한 내용은 이용 약관을 참조하세요.
오픈 소스 스크립트
트레이딩뷰의 진정한 정신에 따라, 이 스크립트의 작성자는 이를 오픈소스로 공개하여 트레이더들이 기능을 검토하고 검증할 수 있도록 했습니다. 작성자에게 찬사를 보냅니다! 이 코드는 무료로 사용할 수 있지만, 코드를 재게시하는 경우 하우스 룰이 적용된다는 점을 기억하세요.
면책사항
해당 정보와 게시물은 금융, 투자, 트레이딩 또는 기타 유형의 조언이나 권장 사항으로 간주되지 않으며, 트레이딩뷰에서 제공하거나 보증하는 것이 아닙니다. 자세한 내용은 이용 약관을 참조하세요.