OPEN-SOURCE SCRIPT
Stefan Krecher: Jeddingen Divergence
The main idea is to identify a divergence between momentum and price movement. E.g. if the momentum is rising but price is going down - this is what we call a divergence. The divergence will be calculated by comparing the direction of the linear regression curve of the price with the linear regression curve of momentum.
A bearish divergence can be identified by a thick red line, a bullish divergence by a green line.
When there is a divergence, it is likeley that the current trend will change it's direction.
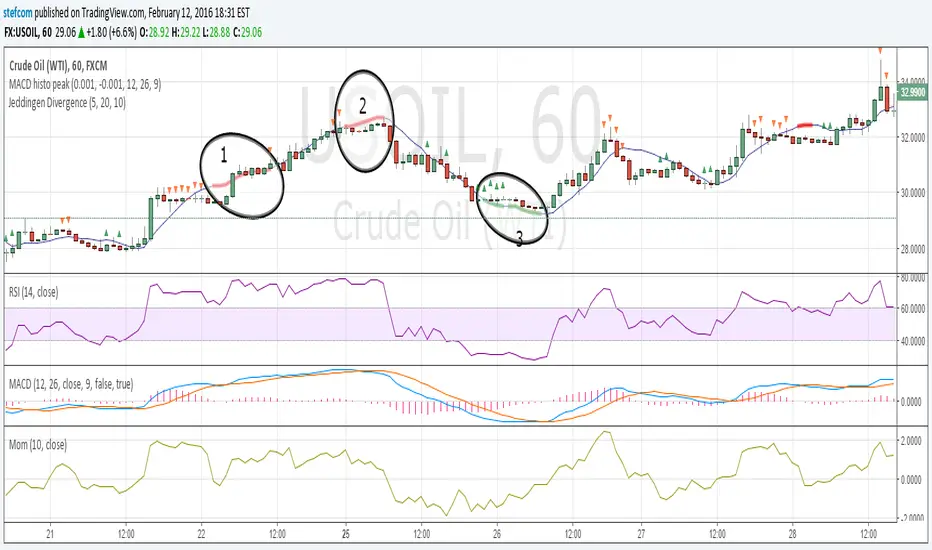
Looking at the chart, there are three divergences that need to get interpreted:
1) bearish divergence, RSI is overbought but MACD does not clearly indicate a trend change. Right after the divergence, price and momentum are going up. No clear signal for a sell trade
2) bearish divergence, RSI still overbought, MACD histogram peaked, MACD crossed the signal line, price and momentum are going down. Very clear constellation for a sell trade.
3) two bullish diverences, RSI is oversold, MACD crossover near the end of the second divergence, price and momentum started rising. Good constellation for a buy trade. Could act as exit signal for the beforementioned sell trade.
More information on the Jeddingen Divergence is available here: https://www.forexpython.com/strategy
A bearish divergence can be identified by a thick red line, a bullish divergence by a green line.
When there is a divergence, it is likeley that the current trend will change it's direction.
Looking at the chart, there are three divergences that need to get interpreted:
1) bearish divergence, RSI is overbought but MACD does not clearly indicate a trend change. Right after the divergence, price and momentum are going up. No clear signal for a sell trade
2) bearish divergence, RSI still overbought, MACD histogram peaked, MACD crossed the signal line, price and momentum are going down. Very clear constellation for a sell trade.
3) two bullish diverences, RSI is oversold, MACD crossover near the end of the second divergence, price and momentum started rising. Good constellation for a buy trade. Could act as exit signal for the beforementioned sell trade.
More information on the Jeddingen Divergence is available here: https://www.forexpython.com/strategy
오픈 소스 스크립트
진정한 트레이딩뷰 정신에 따라 이 스크립트 작성자는 트레이더가 기능을 검토하고 검증할 수 있도록 오픈소스로 공개했습니다. 작성자에게 찬사를 보냅니다! 무료로 사용할 수 있지만 코드를 다시 게시할 경우 하우스 룰이 적용된다는 점을 기억하세요.
⚡ ProDivergence buy.stripe.com/3cs14e15h6FiaBy6oo
⚡ ProTrend buy.stripe.com/4gweV49BN5Be4da8wx
⚡ GET THE CCIDivergence STUDY FOR FREE: bit.ly/CCIDivFree
⚡ ProTrend buy.stripe.com/4gweV49BN5Be4da8wx
⚡ GET THE CCIDivergence STUDY FOR FREE: bit.ly/CCIDivFree
면책사항
이 정보와 게시물은 TradingView에서 제공하거나 보증하는 금융, 투자, 거래 또는 기타 유형의 조언이나 권고 사항을 의미하거나 구성하지 않습니다. 자세한 내용은 이용 약관을 참고하세요.