OPEN-SOURCE SCRIPT
Simple Trend Strength & Momentum
This indicator will show a combination of Trend Strength, Volatility using an Adaptive Moving Average (AMA), and Market Momentum.
You can use this indicator to identify trends, volatility, and momentum shifts in real-time, making it an excellent tool for both trend-following and breakout strategies.
The three main features of this indicator are:
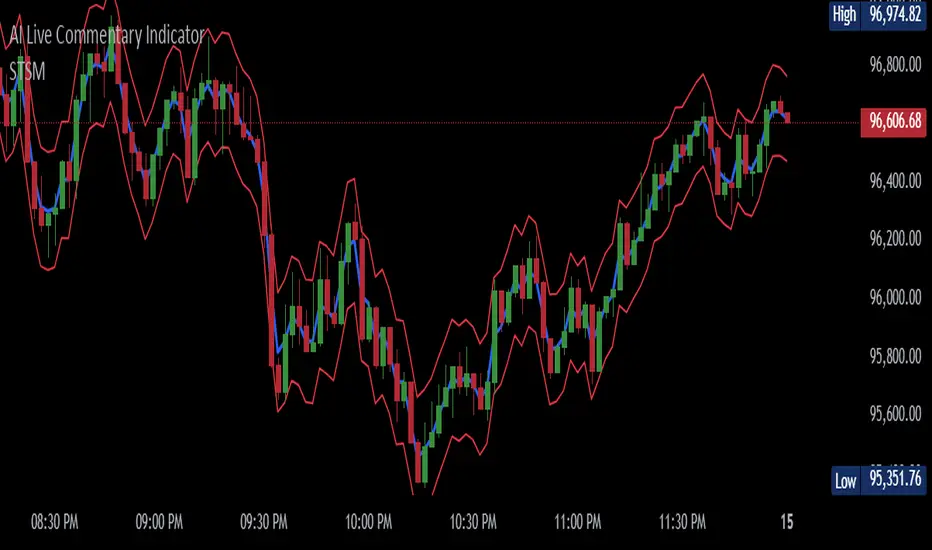
Adaptive Moving Average (AMA): Tracks the trend direction with a dynamic smoothing factor that adjusts based on market volatility. The AMA line changes color based on trend strength (green for bullish, red for bearish). I manually compute the Adaptive Moving Average (AMA) using a smoothing factor derived from the market's efficiency ratio. I have used fastLength and slowLength to control the responsiveness of the AMA.
Volatility Bands: Plots upper and lower bands around the AMA line, indicating price volatility. These bands dynamically adjust based on ATR, with a color gradient that changes intensity based on market volatility.
Momentum Circles: Positive momentum (ROC above the threshold) is shown as a green circle below the bar, while negative momentum is marked by a red circle above the bar. This makes it easy to spot momentum shifts.
The green dots in the indicator represent positive momentum. Specifically, they are displayed when the Rate of Change (ROC) of the price exceeds a predefined threshold (set as threshold in the input). This indicates that the market is experiencing upward price movement at a rate faster than the defined threshold.
How it works:
Rate of Change (ROC) measures the percentage change in price over a specified period (in this case, 14 periods).
When the ROC is greater than the set threshold (1.5 by default), a green circle (dot) is plotted below the price bar to signal that there is significant positive momentum.
This can be seen as an indicator of bullish momentum, where price is increasing at a relatively fast pace compared to previous periods.
The green dots help you spot when the price is moving upward rapidly, potentially signaling a good time to enter a long position or watch for further price action.
NOTE: It is vice versa for red dots.
You can use this indicator to identify trends, volatility, and momentum shifts in real-time, making it an excellent tool for both trend-following and breakout strategies.
The three main features of this indicator are:
Adaptive Moving Average (AMA): Tracks the trend direction with a dynamic smoothing factor that adjusts based on market volatility. The AMA line changes color based on trend strength (green for bullish, red for bearish). I manually compute the Adaptive Moving Average (AMA) using a smoothing factor derived from the market's efficiency ratio. I have used fastLength and slowLength to control the responsiveness of the AMA.
Volatility Bands: Plots upper and lower bands around the AMA line, indicating price volatility. These bands dynamically adjust based on ATR, with a color gradient that changes intensity based on market volatility.
Momentum Circles: Positive momentum (ROC above the threshold) is shown as a green circle below the bar, while negative momentum is marked by a red circle above the bar. This makes it easy to spot momentum shifts.
The green dots in the indicator represent positive momentum. Specifically, they are displayed when the Rate of Change (ROC) of the price exceeds a predefined threshold (set as threshold in the input). This indicates that the market is experiencing upward price movement at a rate faster than the defined threshold.
How it works:
Rate of Change (ROC) measures the percentage change in price over a specified period (in this case, 14 periods).
When the ROC is greater than the set threshold (1.5 by default), a green circle (dot) is plotted below the price bar to signal that there is significant positive momentum.
This can be seen as an indicator of bullish momentum, where price is increasing at a relatively fast pace compared to previous periods.
The green dots help you spot when the price is moving upward rapidly, potentially signaling a good time to enter a long position or watch for further price action.
NOTE: It is vice versa for red dots.
오픈 소스 스크립트
트레이딩뷰의 진정한 정신에 따라, 이 스크립트의 작성자는 이를 오픈소스로 공개하여 트레이더들이 기능을 검토하고 검증할 수 있도록 했습니다. 작성자에게 찬사를 보냅니다! 이 코드는 무료로 사용할 수 있지만, 코드를 재게시하는 경우 하우스 룰이 적용된다는 점을 기억하세요.
면책사항
해당 정보와 게시물은 금융, 투자, 트레이딩 또는 기타 유형의 조언이나 권장 사항으로 간주되지 않으며, 트레이딩뷰에서 제공하거나 보증하는 것이 아닙니다. 자세한 내용은 이용 약관을 참조하세요.
오픈 소스 스크립트
트레이딩뷰의 진정한 정신에 따라, 이 스크립트의 작성자는 이를 오픈소스로 공개하여 트레이더들이 기능을 검토하고 검증할 수 있도록 했습니다. 작성자에게 찬사를 보냅니다! 이 코드는 무료로 사용할 수 있지만, 코드를 재게시하는 경우 하우스 룰이 적용된다는 점을 기억하세요.
면책사항
해당 정보와 게시물은 금융, 투자, 트레이딩 또는 기타 유형의 조언이나 권장 사항으로 간주되지 않으며, 트레이딩뷰에서 제공하거나 보증하는 것이 아닙니다. 자세한 내용은 이용 약관을 참조하세요.