OPEN-SOURCE SCRIPT
업데이트됨 Omega_galsky
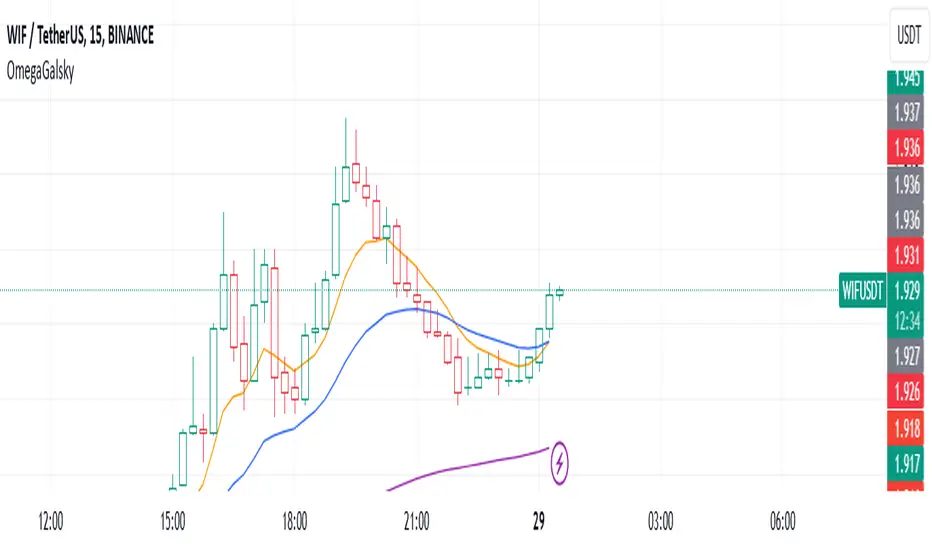
The strategy uses three Exponential Moving Averages (EMAs) — EMA8, EMA21, and EMA89 — to decide when to open buy or sell trades. It also includes a mechanism to move the Stop Loss (SL) to the Break-Even (BE) point, which is the entry price, once the price reaches a Risk-to-Reward (R2R) ratio of 1:1.
Key Steps:
Calculating EMAs: The script computes the EMA values for the specified periods. These help identify market trends and potential entry points.
Buy Conditions:
EMA8 crosses above EMA21.
The candle that causes the crossover is green (closing price is higher than the opening price).
The closing price is above EMA89.
If all conditions are met, a buy order is executed.
Sell Conditions:
EMA8 crosses below EMA21.
The candle that causes the crossover is red (closing price is lower than the opening price).
The closing price is below EMA89.
If all conditions are met, a sell order is executed.
Stop Loss and Take Profit:
Initial Stop Loss and Take Profit levels are calculated based on the entry price and a percentage defined by the user.
These levels help protect against large losses and lock in profits.
Break-Even Logic:
When the price moves favorably to reach a 1:1 R2R ratio:
For a buy trade, the Stop Loss is moved to the entry price if the price increases sufficiently.
For a sell trade, the Stop Loss is moved to the entry price if the price decreases sufficiently.
This ensures the trade is risk-free after the price reaches the predefined level.
Visual Representation:
The EMAs are plotted on the chart for easy visualization of trends and crossovers.
Entry and exit points are also marked on the chart to track trades.
Purpose:
The strategy is designed to capitalize on EMA crossovers while minimizing risks using Break-Even logic and predefined Stop Loss/Take Profit levels. It automates decision-making for trend-following traders and ensures disciplined risk management.
릴리즈 노트
The strategy uses three Exponential Moving Averages (EMAs) — EMA8, EMA21, and EMA89 — to decide when to open buy or sell trades. It also includes a mechanism to move the Stop Loss (SL) to the Break-Even (BE) point, which is the entry price, once the price reaches a Risk-to-Reward (R2R) ratio of 1:1.Key Steps:
Calculating EMAs: The script computes the EMA values for the specified periods. These help identify market trends and potential entry points.
Buy Conditions:
EMA8 crosses above EMA21.
The candle that causes the crossover is green (closing price is higher than the opening price).
The closing price is above EMA89.
If all conditions are met, a buy order is executed.
Sell Conditions:
EMA8 crosses below EMA21.
The candle that causes the crossover is red (closing price is lower than the opening price).
The closing price is below EMA89.
If all conditions are met, a sell order is executed.
Stop Loss and Take Profit:
Initial Stop Loss and Take Profit levels are calculated based on the entry price and a percentage defined by the user.
These levels help protect against large losses and lock in profits.
Break-Even Logic:
When the price moves favorably to reach a 1:1 R2R ratio:
For a buy trade, the Stop Loss is moved to the entry price if the price increases sufficiently.
For a sell trade, the Stop Loss is moved to the entry price if the price decreases sufficiently.
This ensures the trade is risk-free after the price reaches the predefined level.
Visual Representation:
The EMAs are plotted on the chart for easy visualization of trends and crossovers.
Entry and exit points are also marked on the chart to track trades.
Purpose:
The strategy is designed to capitalize on EMA crossovers while minimizing risks using Break-Even logic and predefined Stop Loss/Take Profit levels. It automates decision-making for trend-following traders and ensures disciplined risk management.
오픈 소스 스크립트
트레이딩뷰의 진정한 정신에 따라, 이 스크립트의 작성자는 이를 오픈소스로 공개하여 트레이더들이 기능을 검토하고 검증할 수 있도록 했습니다. 작성자에게 찬사를 보냅니다! 이 코드는 무료로 사용할 수 있지만, 코드를 재게시하는 경우 하우스 룰이 적용된다는 점을 기억하세요.
면책사항
해당 정보와 게시물은 금융, 투자, 트레이딩 또는 기타 유형의 조언이나 권장 사항으로 간주되지 않으며, 트레이딩뷰에서 제공하거나 보증하는 것이 아닙니다. 자세한 내용은 이용 약관을 참조하세요.
오픈 소스 스크립트
트레이딩뷰의 진정한 정신에 따라, 이 스크립트의 작성자는 이를 오픈소스로 공개하여 트레이더들이 기능을 검토하고 검증할 수 있도록 했습니다. 작성자에게 찬사를 보냅니다! 이 코드는 무료로 사용할 수 있지만, 코드를 재게시하는 경우 하우스 룰이 적용된다는 점을 기억하세요.
면책사항
해당 정보와 게시물은 금융, 투자, 트레이딩 또는 기타 유형의 조언이나 권장 사항으로 간주되지 않으며, 트레이딩뷰에서 제공하거나 보증하는 것이 아닙니다. 자세한 내용은 이용 약관을 참조하세요.