OPEN-SOURCE SCRIPT
Consensio with colouring
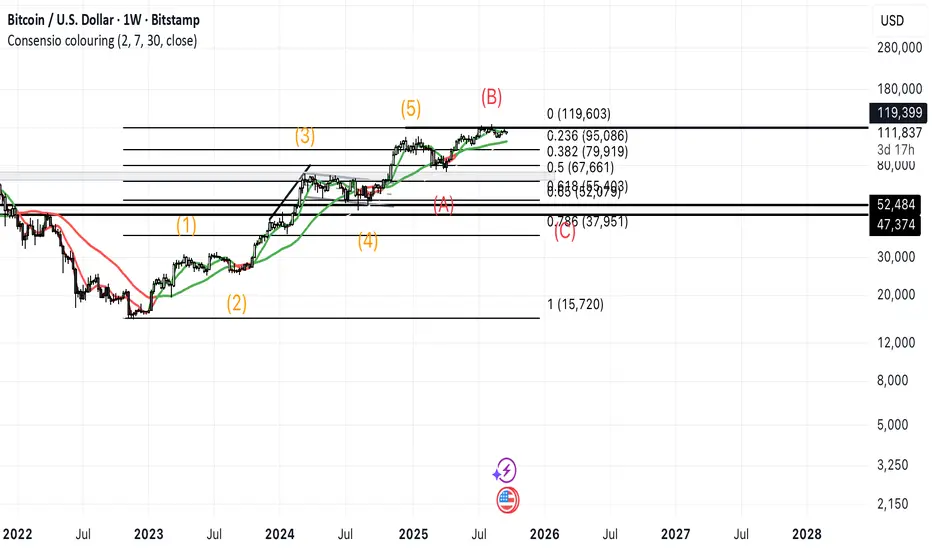
Consensio MA - Short MA with Colouring
This is a trend-following indicator based on the stacking order of three Simple Moving Averages (SMAs) to determine market consensus and visualize strength using a monochrome scale.
Key Features:
Three Customizable SMAs:
Fast MA (Default: 2)
Standard MA (Default: 7)
Slow MA (Default: 30)
Consensus Index:
The indicator assigns a score from +3 (Strongest Buy) to -3 (Strongest Sell) based on the MAs' vertical order (e.g., Fast > Standard > Slow is +3).
Monochrome Bar Colouring:
Bullish Consensus (+1 to +3): Bars are coloured in shades of White to Light Gray.
Bearish Consensus (-1 to -3): Bars are coloured in shades of Black to Dark Gray.
The intensity of the colour directly reflects the strength of the consensus.
Dynamic MA Line Colouring:
Fast MA: Changes colour upon crossing the Standard or Slow MA to signal short-term momentum shifts.
Standard MA: Changes to Green/Red when crossing the Slow MA.
Slow MA: Changes to Green/Red only when the strongest consensus (+3 or -3) is achieved.
How to Interpret:
Strong Bullish Trend (+3): MAs are perfectly aligned (Fast > Standard > Slow) and the bar is pure White.
Strong Bearish Trend (-3): MAs are perfectly reversed (Slow > Standard > Fast) and the bar is pure Black.
Contradictory Signals: Use the Fast MA's colour changes (Dark Green/Red) to spot immediate momentum changes even if the bar colour indicates a weaker trend.
오픈 소스 스크립트
트레이딩뷰의 진정한 정신에 따라, 이 스크립트의 작성자는 이를 오픈소스로 공개하여 트레이더들이 기능을 검토하고 검증할 수 있도록 했습니다. 작성자에게 찬사를 보냅니다! 이 코드는 무료로 사용할 수 있지만, 코드를 재게시하는 경우 하우스 룰이 적용된다는 점을 기억하세요.
면책사항
해당 정보와 게시물은 금융, 투자, 트레이딩 또는 기타 유형의 조언이나 권장 사항으로 간주되지 않으며, 트레이딩뷰에서 제공하거나 보증하는 것이 아닙니다. 자세한 내용은 이용 약관을 참조하세요.
오픈 소스 스크립트
트레이딩뷰의 진정한 정신에 따라, 이 스크립트의 작성자는 이를 오픈소스로 공개하여 트레이더들이 기능을 검토하고 검증할 수 있도록 했습니다. 작성자에게 찬사를 보냅니다! 이 코드는 무료로 사용할 수 있지만, 코드를 재게시하는 경우 하우스 룰이 적용된다는 점을 기억하세요.
면책사항
해당 정보와 게시물은 금융, 투자, 트레이딩 또는 기타 유형의 조언이나 권장 사항으로 간주되지 않으며, 트레이딩뷰에서 제공하거나 보증하는 것이 아닙니다. 자세한 내용은 이용 약관을 참조하세요.