PROTECTED SOURCE SCRIPT
업데이트됨 lvl charm
https://www.tradingview.com/x/oJjs7HHF/
Overview
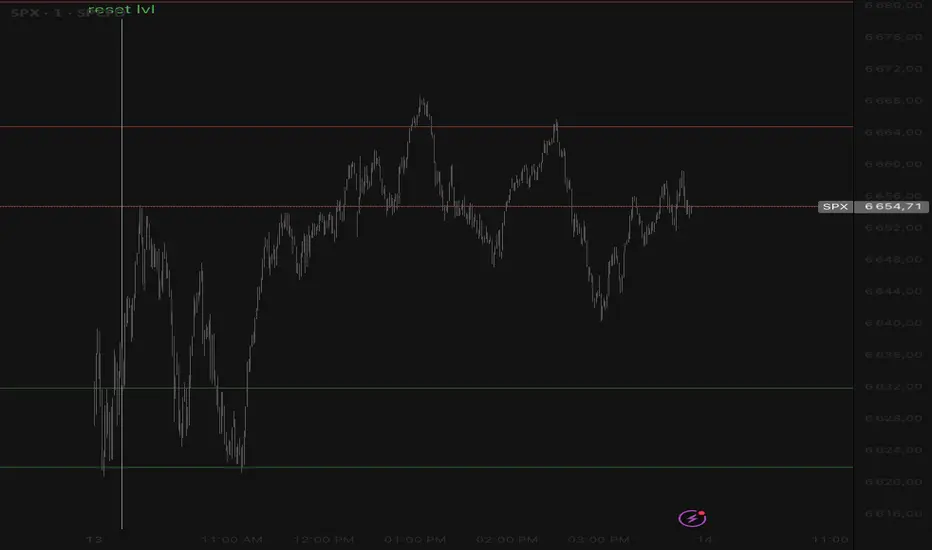
"lvl"is a sophisticated support and resistance indicator that combines mathematical concepts with options market data to identify key price levels.
Key Features
Data-Driven Anchoring: Utilizes real options flow data and peak gamma concentration points
Mathematical Precision: Employs advanced mathematical ratios and distribution patterns to calculate optimal level spacing
Multiple Trading Modes: Optimized for both intraday and large expansion market conditions
Customizable Visualization: Full control over appearance, line styles, and label display
Important Usage Notes
Reset Times: The indicator performs data resets at:
8:30 AM (Pre-market calculation)
Disclaimer
This is a technical analysis tool, not a complete trading strategy. It should be used in conjunction with other forms of analysis, risk management, and your own market understanding. The indicator identifies potential levels of interest based on options market structure but does not provide buy/sell signals or guarantee any specific market outcomes.
Feedback & Development
I welcome constructive criticism and suggestions for improvement. This indicator is continuously being refined based on real market performance and user feedback. Please feel free to share your experiences and ideas in the comments.
Acknowledgments
Special thanks to Gaspard, Adam and Zaiden for their invaluable insights and contributions during the development of this indicator. Their expertise in options market dynamics and mathematical modeling has been instrumental in creating this tool.
PS : I use "large expansion" mode
Overview
"lvl"is a sophisticated support and resistance indicator that combines mathematical concepts with options market data to identify key price levels.
Key Features
Data-Driven Anchoring: Utilizes real options flow data and peak gamma concentration points
Mathematical Precision: Employs advanced mathematical ratios and distribution patterns to calculate optimal level spacing
Multiple Trading Modes: Optimized for both intraday and large expansion market conditions
Customizable Visualization: Full control over appearance, line styles, and label display
Important Usage Notes
Reset Times: The indicator performs data resets at:
8:30 AM (Pre-market calculation)
Disclaimer
This is a technical analysis tool, not a complete trading strategy. It should be used in conjunction with other forms of analysis, risk management, and your own market understanding. The indicator identifies potential levels of interest based on options market structure but does not provide buy/sell signals or guarantee any specific market outcomes.
Feedback & Development
I welcome constructive criticism and suggestions for improvement. This indicator is continuously being refined based on real market performance and user feedback. Please feel free to share your experiences and ideas in the comments.
Acknowledgments
Special thanks to Gaspard, Adam and Zaiden for their invaluable insights and contributions during the development of this indicator. Their expertise in options market dynamics and mathematical modeling has been instrumental in creating this tool.
PS : I use "large expansion" mode
릴리즈 노트
reset london릴리즈 노트
reset 8:30릴리즈 노트
new one (better imo) PS : je ne peux pas le mettre a jours donc c'est en teste ne l'utilisez pas보호된 스크립트입니다
이 스크립트는 비공개 소스로 게시됩니다. 하지만 제한 없이 자유롭게 사용할 수 있습니다 — 여기에서 자세히 알아보기.
면책사항
이 정보와 게시물은 TradingView에서 제공하거나 보증하는 금융, 투자, 거래 또는 기타 유형의 조언이나 권고 사항을 의미하거나 구성하지 않습니다. 자세한 내용은 이용 약관을 참고하세요.
면책사항
이 정보와 게시물은 TradingView에서 제공하거나 보증하는 금융, 투자, 거래 또는 기타 유형의 조언이나 권고 사항을 의미하거나 구성하지 않습니다. 자세한 내용은 이용 약관을 참고하세요.