OPEN-SOURCE SCRIPT
52-Week & 5-Year High/Low with Dates
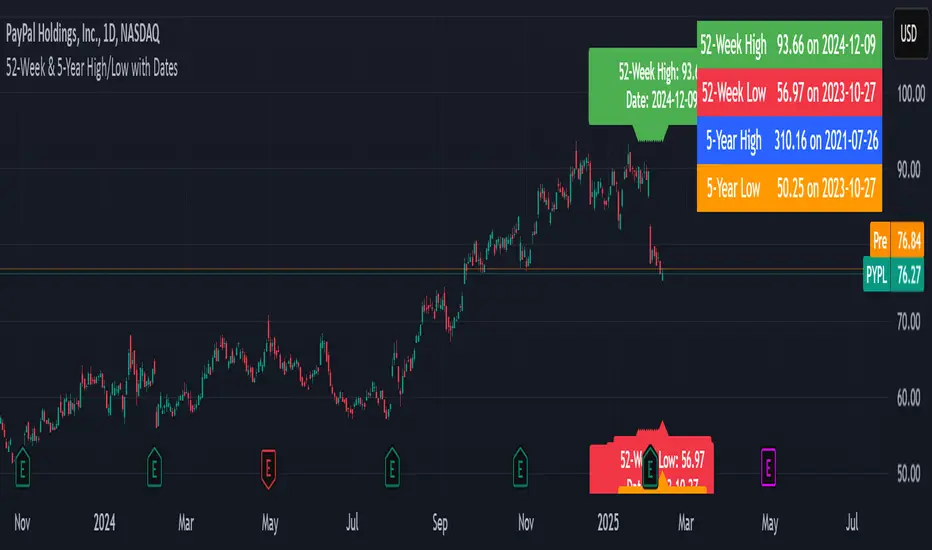
This indicator is designed to help traders quickly identify key price levels and their historical context by displaying the 52-week high/low and 5-year high/low prices along with their respective dates. It provides a clear visual representation of these levels directly on the chart and in a dashboard table for easy reference.
Key Features
52-Week High/Low:
Displays the highest and lowest prices over the last 252 trading days (approximately 52 weeks).
Includes the exact date when these levels were reached.
5-Year High/Low:
Displays the highest and lowest prices over the last 1260 trading days (approximately 5 years).
Includes the exact date when these levels were reached.
Visual Labels:
High and low levels are marked on the chart with labels that include the price and date.
Dashboard Table:
A table in the top-right corner of the chart summarizes the 52-week and 5-year high/low prices and their dates for quick reference.
Customizable Date Format:
Dates are displayed in the YYYY-MM-DD format for clarity and consistency.
오픈 소스 스크립트
트레이딩뷰의 진정한 정신에 따라, 이 스크립트의 작성자는 이를 오픈소스로 공개하여 트레이더들이 기능을 검토하고 검증할 수 있도록 했습니다. 작성자에게 찬사를 보냅니다! 이 코드는 무료로 사용할 수 있지만, 코드를 재게시하는 경우 하우스 룰이 적용된다는 점을 기억하세요.
면책사항
해당 정보와 게시물은 금융, 투자, 트레이딩 또는 기타 유형의 조언이나 권장 사항으로 간주되지 않으며, 트레이딩뷰에서 제공하거나 보증하는 것이 아닙니다. 자세한 내용은 이용 약관을 참조하세요.
오픈 소스 스크립트
트레이딩뷰의 진정한 정신에 따라, 이 스크립트의 작성자는 이를 오픈소스로 공개하여 트레이더들이 기능을 검토하고 검증할 수 있도록 했습니다. 작성자에게 찬사를 보냅니다! 이 코드는 무료로 사용할 수 있지만, 코드를 재게시하는 경우 하우스 룰이 적용된다는 점을 기억하세요.
면책사항
해당 정보와 게시물은 금융, 투자, 트레이딩 또는 기타 유형의 조언이나 권장 사항으로 간주되지 않으며, 트레이딩뷰에서 제공하거나 보증하는 것이 아닙니다. 자세한 내용은 이용 약관을 참조하세요.