OPEN-SOURCE SCRIPT
CPI Inflation Monitor (Change YoY & MoM)
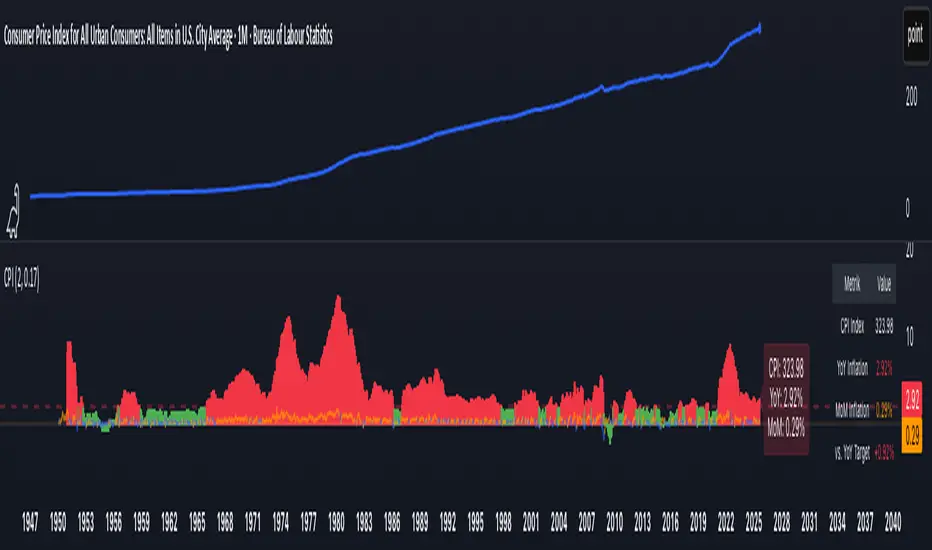
📊 CPI Inflation Monitor - Complete Macro Analysis Tool
This indicator provides a comprehensive view of Consumer Price Index (CPI) inflation trends, essential for understanding monetary policy, market conditions, and making informed trading decisions.
🎯 KEY FEATURES:
- Dual Perspective Analysis:
- Year-over-Year (YoY): Histogram bars showing annual inflation rate
- Month-over-Month (MoM): Line overlay showing monthly price changes
- Visual Reference System:
- Dashed line at 2% (Fed's official inflation target for YoY)
- Dotted line at 0.17% (equivalent monthly target for MoM)
- Color-coded bars: Red above target, Green below target
- Real-Time Data Table:
- Current CPI Index value
- YoY inflation rate with color coding
- MoM inflation rate with color coding
- Deviation from Fed target
- Automated Alerts:
- YoY crosses above/below 2% target
- MoM crosses above/below 0.17% target
- Perfect for staying informed without constant monitoring
📈 WHY THIS MATTERS FOR TRADERS:
CPI is the most widely reported inflation metric and directly influences:
- Federal Reserve interest rate decisions
- Bond yields and currency valuations
- Stock market sentiment (especially growth vs. value rotation)
- Cryptocurrency and risk asset performance
Rising inflation (red bars) typically leads to:
→ Higher interest rates → Negative for growth stocks, crypto
→ Stronger USD → Pressure on commodities
Falling inflation (green bars) typically leads to:
→ Rate cut expectations → Positive for growth stocks, crypto
→ Weaker USD → Support for commodities
🔍 HOW TO USE:
1. Strategic Positioning: Use YoY trend (thick bars) for long-term asset allocation
2. Tactical Timing: Use MoM trend (thin line) to identify turning points early
3. Divergence Trading: When MoM falls but YoY remains high, anticipate trend reversal
4. Fed Policy Prediction: Distance from 2% target indicates Fed's likely hawkishness
💡 PRO TIPS:
- Multiple months of MoM above 0.3% = Accelerating inflation → Fed turns hawkish
- MoM turning negative while YoY still elevated = Peak inflation → Position for pivot
- Compare with PPI and PCE indicators for complete inflation picture
- Use alerts to catch important threshold crossings automatically
📊 DATA SOURCE:
Official CPI data from FRED (Federal Reserve Economic Data), updated monthly mid-month when new data releases occur.
🎨 CUSTOMIZATION:
Fully customizable through settings:
- Toggle YoY/MoM displays
- Adjust target levels
- Customize colors for visual preference
- Show/hide absolute CPI values
Perfect for: Macro traders, swing traders, long-term investors, and anyone wanting to understand the inflation environment affecting their portfolio.
Note: This indicator works on any chart timeframe as it loads external monthly economic data.
오픈 소스 스크립트
트레이딩뷰의 진정한 정신에 따라, 이 스크립트의 작성자는 이를 오픈소스로 공개하여 트레이더들이 기능을 검토하고 검증할 수 있도록 했습니다. 작성자에게 찬사를 보냅니다! 이 코드는 무료로 사용할 수 있지만, 코드를 재게시하는 경우 하우스 룰이 적용된다는 점을 기억하세요.
면책사항
해당 정보와 게시물은 금융, 투자, 트레이딩 또는 기타 유형의 조언이나 권장 사항으로 간주되지 않으며, 트레이딩뷰에서 제공하거나 보증하는 것이 아닙니다. 자세한 내용은 이용 약관을 참조하세요.
오픈 소스 스크립트
트레이딩뷰의 진정한 정신에 따라, 이 스크립트의 작성자는 이를 오픈소스로 공개하여 트레이더들이 기능을 검토하고 검증할 수 있도록 했습니다. 작성자에게 찬사를 보냅니다! 이 코드는 무료로 사용할 수 있지만, 코드를 재게시하는 경우 하우스 룰이 적용된다는 점을 기억하세요.
면책사항
해당 정보와 게시물은 금융, 투자, 트레이딩 또는 기타 유형의 조언이나 권장 사항으로 간주되지 않으며, 트레이딩뷰에서 제공하거나 보증하는 것이 아닙니다. 자세한 내용은 이용 약관을 참조하세요.