INVITE-ONLY SCRIPT
Batman Signal
BATMAN SIGNAL: Identify Potential Reversal Patterns
The Batman Signal is designed to help spot potential reversal patterns that may indicate institutional activity at key price levels. It looks for a distinct "double rejection" structure, with the crucial second rejection accompanied by a liquidity spike (high volume), suggesting significant market participation.
🔑 KEY FEATURES
• Dynamic Support & Resistance Zones: Automatically calculates and draws key zones on your chart, giving an at-a-glance view of major price reaction levels where 'Batman' patterns are most likely to form.
• Momentum Clusters: See market bias instantly. Clusters of green or red dots in the top margin show where bullish or bearish patterns are actively forming. Nested purple diamonds within these clusters highlight high-volume liquidity spikes. Increasing concentration here can provide an early warning for the next major setup.
• Four Powerful, Independent Alerts: Each alert is a robust signal engineered to catch market turns. Use them separately or in sequence based on your style.
• Non-Repainting, Close-Based Signals: All final confirmation triangles plot ONLY AFTER the bar closes, providing dependable execution signals.
• Volume-Spike Confirmation: Core logic identifies "liquidity spikes" (high volume) at key rejection areas, filtering for significant market participation.
• Full Customization: Tune every aspect from trend sensitivity, zone detection, volume filters, pattern timing and structure to match any asset or timeframe.
🦇 THE FOUR BATMAN SIGNALS
The indicator scans for a specific "double rejection" structure:
• "Left Ear" – initial rejection at a key zone.
• "Right Ear" – volume-confirmed rejection at a similar level.
This creates four distinct, non-repainting alerts:
Bullish Right Ear Alert – Early warning at support.
Bearish Right Ear Alert – Early warning at resistance.
Confirmed Bullish Batman Signal – Final trigger after bar close.
Confirmed Bearish Batman Signal – Final trigger after bar close.
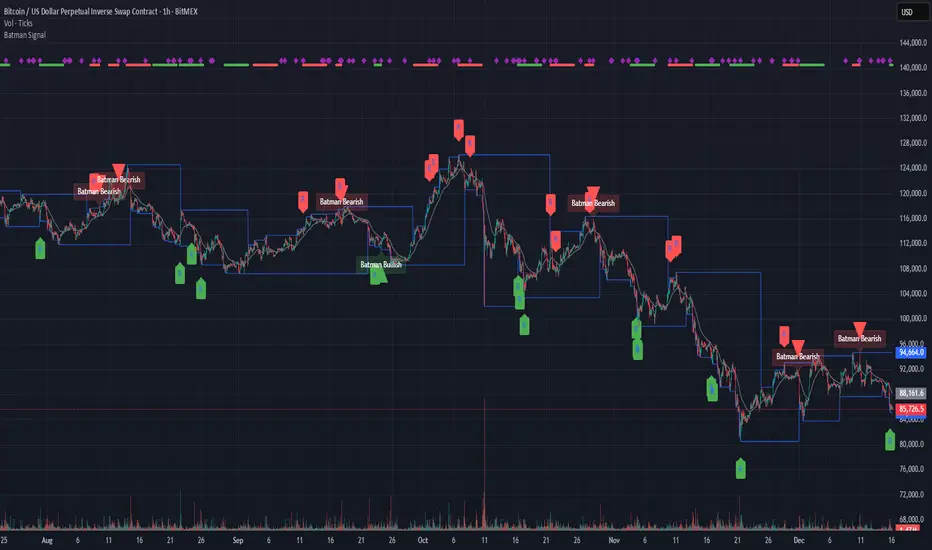
HOW TO READ THE CHART:
• Blue Lines – Dynamic support/resistance zones.
• "R" Labels & Purple Diamonds – Mark developing Right Ear rejections with volume spike.
• Green/Red Triangles – Show the confirmed, final Batman pattern signal.
• Clusters of Green/Red Dots – Show active bullish/bearish pattern zones (top margin).
• Nested Purple Diamonds – Highlight high-volume spikes within clusters.
• Gray EMA – Provides trend context.
⚙️ CUSTOMIZABLE INPUTS
Trend & Zones:
– Trend EMA Period – Adjust baseline trend sensitivity.
– Key Zone Lookback – Set how far back to scan for key levels.
– Zone Tolerance % – Fine-tune the zone width.
Pattern Logic:
– Min/Max Consolidation Bars – Control time window between Left and Right Ear.
– Min Wick Ratio for Right Ear – Filter for strong rejection wicks.
– Min Spike Size (ATR) – Set minimum volatility for the Right Ear.
Volume Filter (Right Ear Only):
– Toggle volume confirmation on/off.
– Volume Lookback Period – Bars used for average volume calculation.
– Min Volume Ratio – Right Ear volume must be this many times above average.
Visual Settings:
– Show/Hide labels and key zones.
– Customize bullish, bearish, and zone colors.
📘 HOW TO TRADE WITH IT
Apply the "Batman Signal" to your chart.
Watch price action at the blue zones and monitor the top-margin dot clusters for active momentum. Nested purple diamonds signal volume spikes.
Set alerts for your preferred signal type (Right Ear for early warning, or final Batman Signal for confirmation).
Alerts are robust and will fire on bar after print.
ALWAYS use sound risk management—define stop-loss and take-profit levels.
Recommended timeframes: 15min and 1 hour for optimal balance.
Works on all timeframes with appropriate tuning.
🔔 IMPORTANT ALERT SETUP TIP
When you change any input setting (e.g., Min Spike Size, Volume Filter), you MUST delete any existing alerts and create new ones.
TradingView saves alerts as a static snapshot of your settings at creation.
This ensures your alerts always match the strategy you see on the chart.
DISCLAIMER:
Note: This indicator is for informational purposes only and does not constitute financial advice.
Users are encouraged to backtest thoroughly and evaluate the indicator's performance in their trading strategy.
The Batman Signal is designed to help spot potential reversal patterns that may indicate institutional activity at key price levels. It looks for a distinct "double rejection" structure, with the crucial second rejection accompanied by a liquidity spike (high volume), suggesting significant market participation.
🔑 KEY FEATURES
• Dynamic Support & Resistance Zones: Automatically calculates and draws key zones on your chart, giving an at-a-glance view of major price reaction levels where 'Batman' patterns are most likely to form.
• Momentum Clusters: See market bias instantly. Clusters of green or red dots in the top margin show where bullish or bearish patterns are actively forming. Nested purple diamonds within these clusters highlight high-volume liquidity spikes. Increasing concentration here can provide an early warning for the next major setup.
• Four Powerful, Independent Alerts: Each alert is a robust signal engineered to catch market turns. Use them separately or in sequence based on your style.
• Non-Repainting, Close-Based Signals: All final confirmation triangles plot ONLY AFTER the bar closes, providing dependable execution signals.
• Volume-Spike Confirmation: Core logic identifies "liquidity spikes" (high volume) at key rejection areas, filtering for significant market participation.
• Full Customization: Tune every aspect from trend sensitivity, zone detection, volume filters, pattern timing and structure to match any asset or timeframe.
🦇 THE FOUR BATMAN SIGNALS
The indicator scans for a specific "double rejection" structure:
• "Left Ear" – initial rejection at a key zone.
• "Right Ear" – volume-confirmed rejection at a similar level.
This creates four distinct, non-repainting alerts:
Bullish Right Ear Alert – Early warning at support.
Bearish Right Ear Alert – Early warning at resistance.
Confirmed Bullish Batman Signal – Final trigger after bar close.
Confirmed Bearish Batman Signal – Final trigger after bar close.
HOW TO READ THE CHART:
• Blue Lines – Dynamic support/resistance zones.
• "R" Labels & Purple Diamonds – Mark developing Right Ear rejections with volume spike.
• Green/Red Triangles – Show the confirmed, final Batman pattern signal.
• Clusters of Green/Red Dots – Show active bullish/bearish pattern zones (top margin).
• Nested Purple Diamonds – Highlight high-volume spikes within clusters.
• Gray EMA – Provides trend context.
⚙️ CUSTOMIZABLE INPUTS
Trend & Zones:
– Trend EMA Period – Adjust baseline trend sensitivity.
– Key Zone Lookback – Set how far back to scan for key levels.
– Zone Tolerance % – Fine-tune the zone width.
Pattern Logic:
– Min/Max Consolidation Bars – Control time window between Left and Right Ear.
– Min Wick Ratio for Right Ear – Filter for strong rejection wicks.
– Min Spike Size (ATR) – Set minimum volatility for the Right Ear.
Volume Filter (Right Ear Only):
– Toggle volume confirmation on/off.
– Volume Lookback Period – Bars used for average volume calculation.
– Min Volume Ratio – Right Ear volume must be this many times above average.
Visual Settings:
– Show/Hide labels and key zones.
– Customize bullish, bearish, and zone colors.
📘 HOW TO TRADE WITH IT
Apply the "Batman Signal" to your chart.
Watch price action at the blue zones and monitor the top-margin dot clusters for active momentum. Nested purple diamonds signal volume spikes.
Set alerts for your preferred signal type (Right Ear for early warning, or final Batman Signal for confirmation).
Alerts are robust and will fire on bar after print.
ALWAYS use sound risk management—define stop-loss and take-profit levels.
Recommended timeframes: 15min and 1 hour for optimal balance.
Works on all timeframes with appropriate tuning.
🔔 IMPORTANT ALERT SETUP TIP
When you change any input setting (e.g., Min Spike Size, Volume Filter), you MUST delete any existing alerts and create new ones.
TradingView saves alerts as a static snapshot of your settings at creation.
This ensures your alerts always match the strategy you see on the chart.
DISCLAIMER:
Note: This indicator is for informational purposes only and does not constitute financial advice.
Users are encouraged to backtest thoroughly and evaluate the indicator's performance in their trading strategy.
초대 전용 스크립트
이 스크립트는 작성자가 승인한 사용자만 접근할 수 있습니다. 사용하려면 요청 후 승인을 받아야 하며, 일반적으로 결제 후에 허가가 부여됩니다. 자세한 내용은 아래 작성자의 안내를 따르거나 GreenIce_Firefall에게 직접 문의하세요.
트레이딩뷰는 스크립트의 작동 방식을 충분히 이해하고 작성자를 완전히 신뢰하지 않는 이상, 해당 스크립트에 비용을 지불하거나 사용하는 것을 권장하지 않습니다. 커뮤니티 스크립트에서 무료 오픈소스 대안을 찾아보실 수도 있습니다.
작성자 지시 사항
Email me at greenicefirefall@gmail.com
면책사항
해당 정보와 게시물은 금융, 투자, 트레이딩 또는 기타 유형의 조언이나 권장 사항으로 간주되지 않으며, 트레이딩뷰에서 제공하거나 보증하는 것이 아닙니다. 자세한 내용은 이용 약관을 참조하세요.