OPEN-SOURCE SCRIPT
업데이트됨 Bullseye NYSE 1st5m
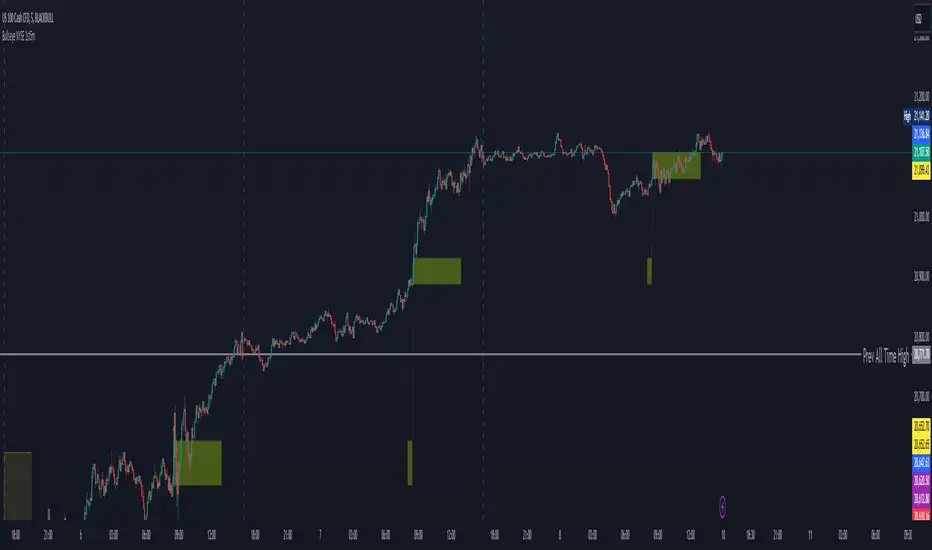
This script, "BullseyeNYSE1st5m," is a TradingView indicator designed to highlight the high and low price levels during the first 5 minutes of the NYSE trading session. It works as follows:
1. **Identify NYSE Trading Hours**: The script identifies bars that fall within NYSE trading hours, specifically focusing on the first five minutes after the market opens.
2. **Calculate First 5-Minute High and Low**: During the first five minutes of the trading day, the script captures and updates the high and low prices, storing these values for the remainder of the session.
3. **Plot High and Low Levels**: The high and low values from the first five minutes are plotted as lines on the chart in yellow. This helps traders quickly identify the initial range set by the market.
4. **Fill the Area Between High and Low**: The area between the high and low levels is filled with a translucent yellow color to visually emphasize the first five-minute range.
5. **Alerts for Breakouts**: Alerts are set to notify the user when the price closes above or below the first five-minute range. This helps traders stay informed of potential breakout opportunities beyond this key opening range.
This indicator is useful for day traders looking to leverage the first few minutes of NYSE trading to identify early support and resistance levels and to spot breakout opportunities.
릴리즈 노트
UPDATE: The Background is only visible. keep the chart clean.릴리즈 노트
Functional on higher timeframes릴리즈 노트
This updated "Bullseye NYSE 1st5m" script is designed to highlight the first five-minute trading range of the NYSE session. It includes an adjustable start time for NYSE trading hours, allowing the user to modify the hour as needed. The script calculates the high and low for the first five minutes of trading, plots these levels, and fills the area between them for easy visualization. Additionally, alerts are provided for breakouts above or below the five-minute range. The script also includes an optional daylight savings time adjustment for accurate tracking.오픈 소스 스크립트
트레이딩뷰의 진정한 정신에 따라, 이 스크립트의 작성자는 이를 오픈소스로 공개하여 트레이더들이 기능을 검토하고 검증할 수 있도록 했습니다. 작성자에게 찬사를 보냅니다! 이 코드는 무료로 사용할 수 있지만, 코드를 재게시하는 경우 하우스 룰이 적용된다는 점을 기억하세요.
면책사항
해당 정보와 게시물은 금융, 투자, 트레이딩 또는 기타 유형의 조언이나 권장 사항으로 간주되지 않으며, 트레이딩뷰에서 제공하거나 보증하는 것이 아닙니다. 자세한 내용은 이용 약관을 참조하세요.
오픈 소스 스크립트
트레이딩뷰의 진정한 정신에 따라, 이 스크립트의 작성자는 이를 오픈소스로 공개하여 트레이더들이 기능을 검토하고 검증할 수 있도록 했습니다. 작성자에게 찬사를 보냅니다! 이 코드는 무료로 사용할 수 있지만, 코드를 재게시하는 경우 하우스 룰이 적용된다는 점을 기억하세요.
면책사항
해당 정보와 게시물은 금융, 투자, 트레이딩 또는 기타 유형의 조언이나 권장 사항으로 간주되지 않으며, 트레이딩뷰에서 제공하거나 보증하는 것이 아닙니다. 자세한 내용은 이용 약관을 참조하세요.