OPEN-SOURCE SCRIPT
업데이트됨 Earnings [theUltimator5]
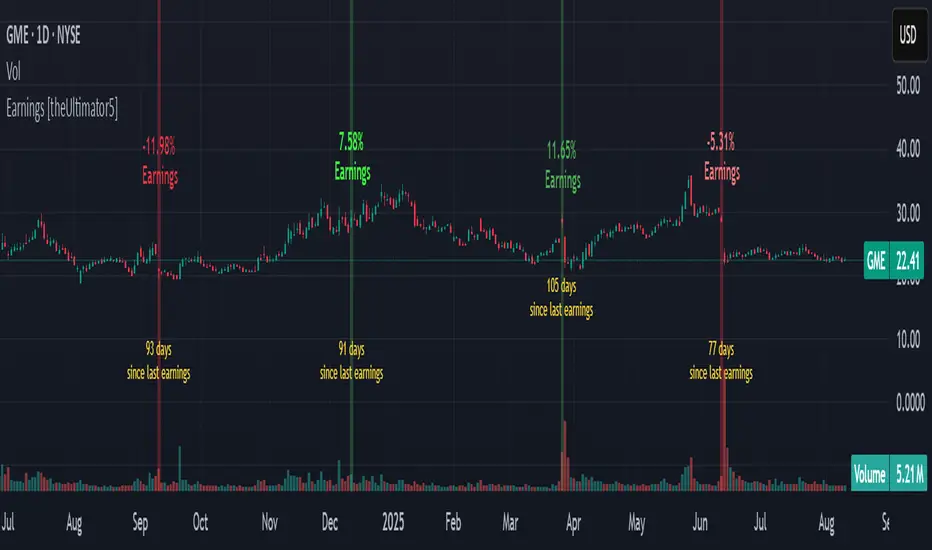
This indicator highlights daily price changes on earnings announcement days using dynamic colors, labels, and optional earnings markers.
🔍 Key Features:
Earnings Detection:
Price Change Calculation:
Color-coded Labels:
Color intensity reflects the size and direction of the move:
Optional "Earnings" Marker:
Background Highlight:
⚙️ User Input:
✅ Show 'E' Marker: Toggles the visibility of the "Earnings" label below the main price change label.
✅ Ideal Use Case:
Use this indicator to visually analyze how a stock reacts on earnings days, helping traders spot consistent behavior patterns (e.g., post-earnings rallies or selloffs).
🔍 Key Features:
Earnings Detection:
- Highlights only the days when an earnings event occurs.
Price Change Calculation:
- Computes the percentage change from open to close on earnings day.
Color-coded Labels:
- Displays the % change as a floating label above the chart on earnings days.
Color intensity reflects the size and direction of the move:
- Bright green for large gains (≥ +10%)
- Bright red for large losses (≤ -10%)
- White for negligible change
- Gradient fades between those extremes
Optional "Earnings" Marker:
- A small label marked “Earnings” appears beneath the % change label, controlled by a user toggle.
Background Highlight:
- The chart background is shaded on earnings days with a semi-transparent color based on the % change.
⚙️ User Input:
✅ Show 'E' Marker: Toggles the visibility of the "Earnings" label below the main price change label.
✅ Ideal Use Case:
Use this indicator to visually analyze how a stock reacts on earnings days, helping traders spot consistent behavior patterns (e.g., post-earnings rallies or selloffs).
릴리즈 노트
Added number of days since last earnings at bottom of chart.Removed option for showing "E" for earnings, and change it to simply be below the price change.
Added user select to show days since last earnings.
릴리즈 노트
I updated the calculation for earnings day percent change. Precious one was incorrect. I also slightly modified how the labels are positioned since they would easily be out of bounds, especially if viewed on mobile. Instead of using a 200 day high/low to create the labels, I now use a 5 day high/low릴리즈 노트
Updated chart to show indicator name in order to abide by house rules.오픈 소스 스크립트
트레이딩뷰의 진정한 정신에 따라, 이 스크립트의 작성자는 이를 오픈소스로 공개하여 트레이더들이 기능을 검토하고 검증할 수 있도록 했습니다. 작성자에게 찬사를 보냅니다! 이 코드는 무료로 사용할 수 있지만, 코드를 재게시하는 경우 하우스 룰이 적용된다는 점을 기억하세요.
면책사항
해당 정보와 게시물은 금융, 투자, 트레이딩 또는 기타 유형의 조언이나 권장 사항으로 간주되지 않으며, 트레이딩뷰에서 제공하거나 보증하는 것이 아닙니다. 자세한 내용은 이용 약관을 참조하세요.
오픈 소스 스크립트
트레이딩뷰의 진정한 정신에 따라, 이 스크립트의 작성자는 이를 오픈소스로 공개하여 트레이더들이 기능을 검토하고 검증할 수 있도록 했습니다. 작성자에게 찬사를 보냅니다! 이 코드는 무료로 사용할 수 있지만, 코드를 재게시하는 경우 하우스 룰이 적용된다는 점을 기억하세요.
면책사항
해당 정보와 게시물은 금융, 투자, 트레이딩 또는 기타 유형의 조언이나 권장 사항으로 간주되지 않으며, 트레이딩뷰에서 제공하거나 보증하는 것이 아닙니다. 자세한 내용은 이용 약관을 참조하세요.