OPEN-SOURCE SCRIPT
Volume Index (0-100)
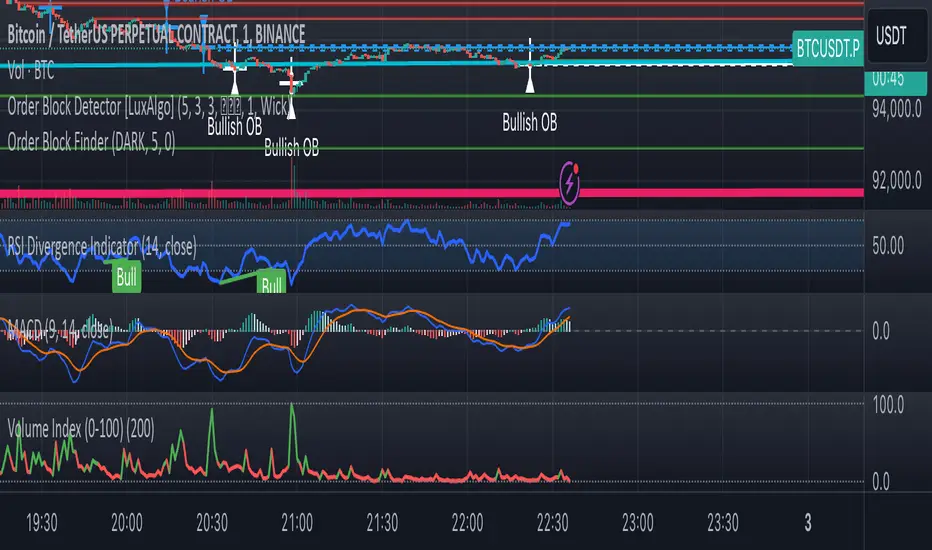
Volume Index (0-100) Indicator
The Volume Index (0-100) indicator is a powerful tool designed to help traders understand current volume levels in relation to past activity over a specified period. By normalizing volume data to a scale from 0 to 100, this indicator makes it easy to compare today's volume against recent history and gauge the strength of market movements.
Key Features:
Normalized Volume Index: The indicator indexes volume between 0 and 100, allowing traders to easily determine if the current volume is unusually high or low compared to recent trends.
Colored Visualization: The line graph is colored green for positive volume (increasing activity) and red for negative volume (decreasing activity). This helps traders quickly grasp the market sentiment and volume direction.
User-Defined Lookback Period: Traders can customize the lookback period to best fit their trading strategy, providing flexibility for different market conditions.
How Traders Can Use It:
Identifying Volume Extremes: The Volume Index helps identify periods of unusually high or low volume. Values approaching 100 indicate high volume, while values close to 0 indicate low volume.
Confirmation Tool: During price movements, high volume (near 100) can act as a confirmation signal for the strength of the trend. For instance, a high volume during an uptrend may indicate strong buying interest.
Divergence Analysis: Traders can look for divergences between volume and price. For example, if the price is consolidating while the Volume Index remains high, it could signal an impending breakout.
Volume Alerts: The indicator includes an alert feature when the Volume Index exceeds 80, helping traders stay informed about potential shifts in market volatility.
오픈 소스 스크립트
트레이딩뷰의 진정한 정신에 따라, 이 스크립트의 작성자는 이를 오픈소스로 공개하여 트레이더들이 기능을 검토하고 검증할 수 있도록 했습니다. 작성자에게 찬사를 보냅니다! 이 코드는 무료로 사용할 수 있지만, 코드를 재게시하는 경우 하우스 룰이 적용된다는 점을 기억하세요.
면책사항
해당 정보와 게시물은 금융, 투자, 트레이딩 또는 기타 유형의 조언이나 권장 사항으로 간주되지 않으며, 트레이딩뷰에서 제공하거나 보증하는 것이 아닙니다. 자세한 내용은 이용 약관을 참조하세요.
오픈 소스 스크립트
트레이딩뷰의 진정한 정신에 따라, 이 스크립트의 작성자는 이를 오픈소스로 공개하여 트레이더들이 기능을 검토하고 검증할 수 있도록 했습니다. 작성자에게 찬사를 보냅니다! 이 코드는 무료로 사용할 수 있지만, 코드를 재게시하는 경우 하우스 룰이 적용된다는 점을 기억하세요.
면책사항
해당 정보와 게시물은 금융, 투자, 트레이딩 또는 기타 유형의 조언이나 권장 사항으로 간주되지 않으며, 트레이딩뷰에서 제공하거나 보증하는 것이 아닙니다. 자세한 내용은 이용 약관을 참조하세요.